

Office Report: Shrinking Pipeline Offers Market Relief
The slowdown in development is helping offset weaker demand, with deliveries expected to bottom out in 2027, the latest Yardi Matrix report shows.
The U.S. office sector is showing signs of stabilization as vacancy continues to decline and asking rents climb, offering some relief to the market, the latest Yardi Matrix national office report shows. However, weak office employment and economic uncertainty still challenge demand, while a shrinking pipeline is helping sustain the sector’s fundamentals.
Despite three years of declining office employment, national listing rates increased 1.2 percent year-over-year as of September, while office vacancy fell 80 basis points.
Vacancy across all property classes has been steadily dropping. However, listing rate performance varied. Class A asking rents increased 3.1 percent year-over-year to $40.62 per square foot, while Class B rates dropped 1.8 percent, reaching $27.07 per square foot. Meanwhile, rates for Class C properties stood at $19.63 per square foot, up 3.2 percent.
This divergence suggests changing tenant behavior, as some companies favor premium, amenity-rich workplaces and others prefer more affordable pricing. Hybrid work models remain widespread, as office utilization has hovered around 55 percent, according to Kastle’s Back to Work Barometer.
Construction activity has slowed significantly since Covid, with completions projected to bottom out at roughly 26 million square feet in 2027. Developers remain cautious, with the ratio of under-construction to planned projects standing at 0.4, suggesting difficulties in advancing planned projects into construction. Higher construction costs driven by interest rates, tariffs and energy constraints could further discourage new projects.
READ ALSO: How Hospitality Is Reshaping the Modern Office
The national vacancy rate stood at 17.8 percent in September— an 80-basis-point annual improvement. San Francisco continued to record the highest vacancy among major markets at 26.7 percent, followed by Seattle at 24.8 percent.
San Diego is also struggling to absorb excess inventory following the pandemic-era life sciences construction boom. In September, the metro’s rate reached a record 23.7 percent, up 140 basis points year-over-year. However, a slowing pipeline could gradually ease pressure on the market.
The national full-service equivalent listing rates averaged $33.18 per square foot in September, down two cents from August but up 1.2 percent year-over-year. Manhattan rents reached $72.03— the country’s most expensive average, while San Francisco followed with $64.92.
Manhattan leads office development activity
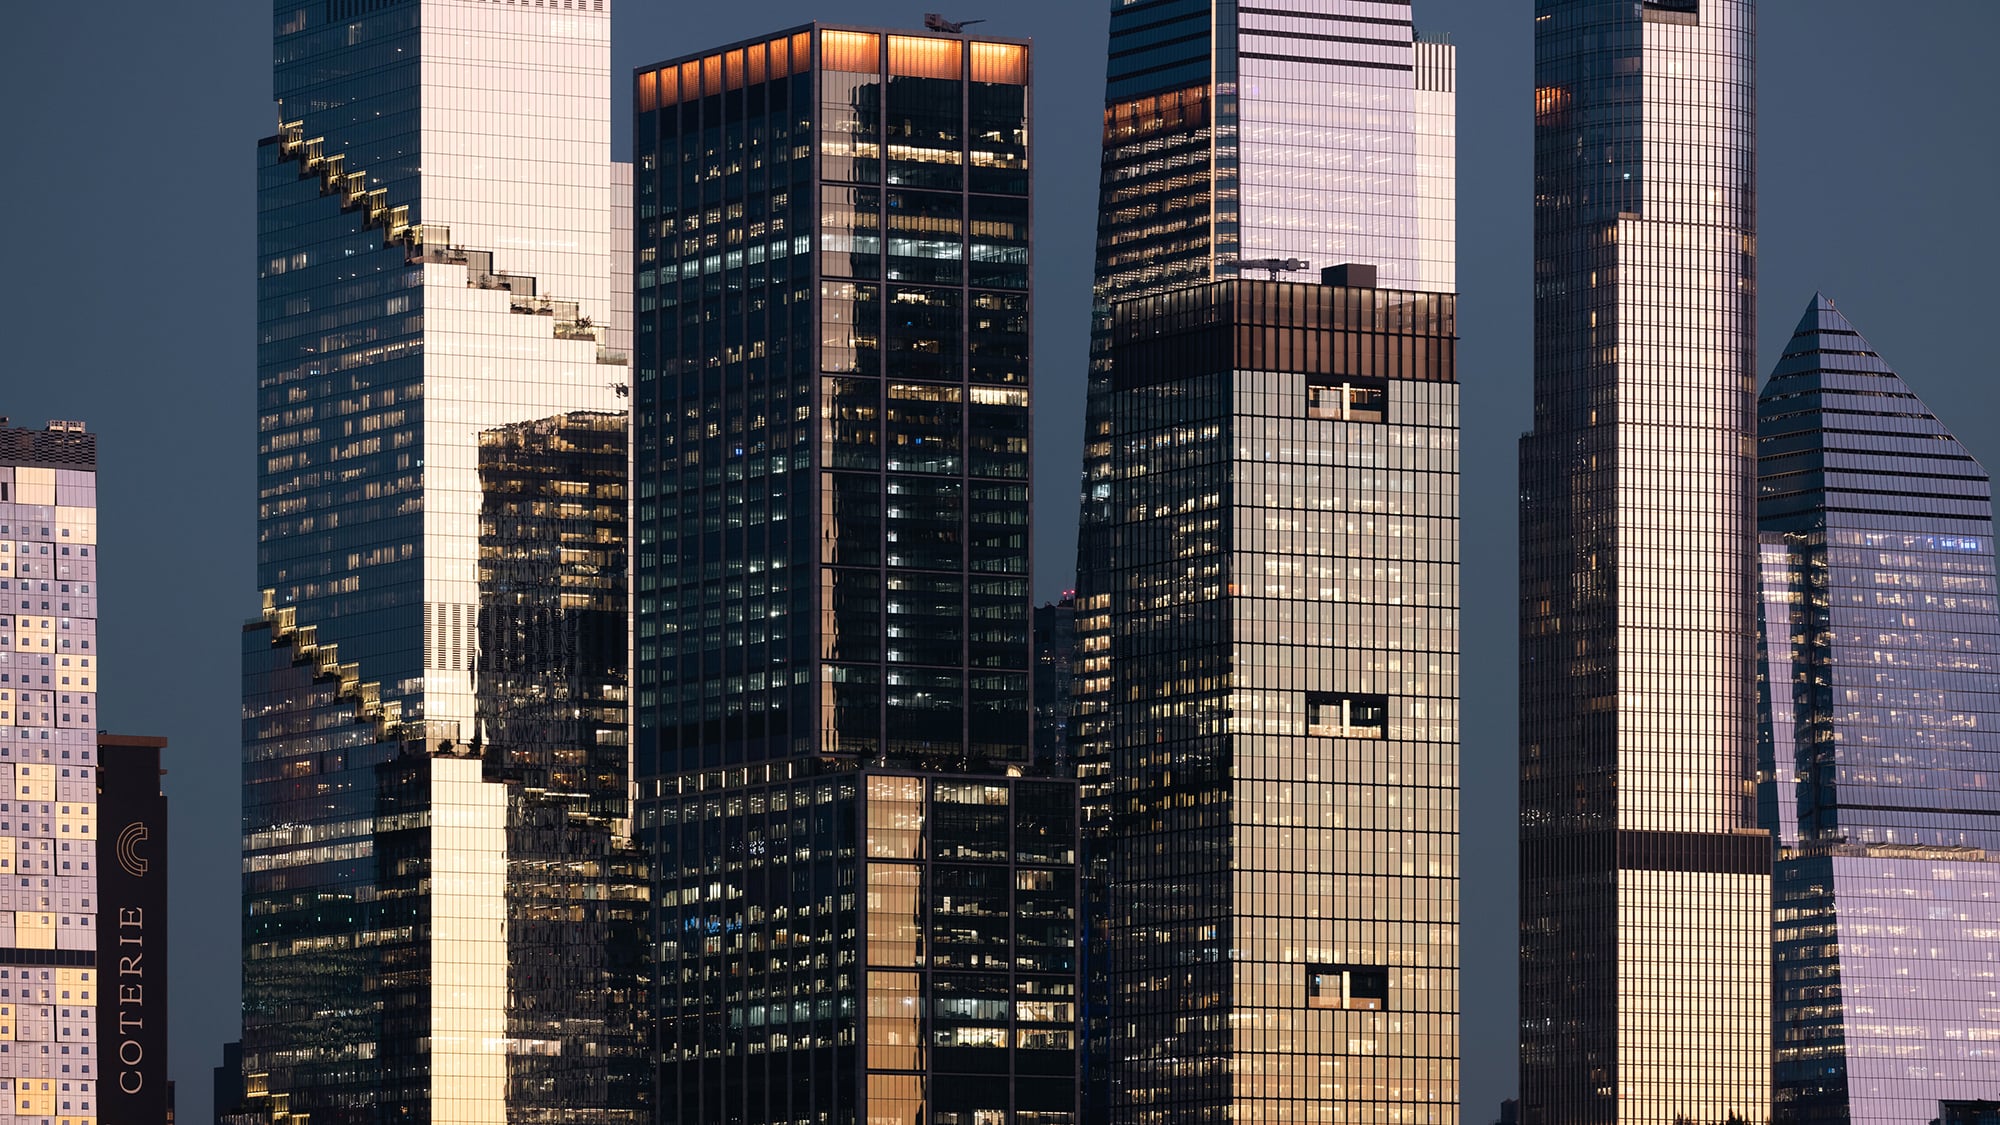
The national under-construction pipeline comprised 32.2 million square feet, representing 0.5 percent of total stock. Manhattan led all markets for development, with 3.6 million square feet under construction as of September, and another 11.1 million square feet in planning stages.
The metro saw nearly 19 million square feet of office completions over the past five years, with another 14 million square feet expected by the end of the decade. So far in 2026, developers broke ground on 1.5 million square feet, suggesting strong demand for Class A space in the borough.
Investment activity totaled $50.5 billion across 2,272 transactions year-to-date through September. Properties sold at $197 per square foot on average. Manhattan led transaction activity with $5.7 billion, followed by the Bay Area at $4.6 billion and Dallas at $3.7 billion.
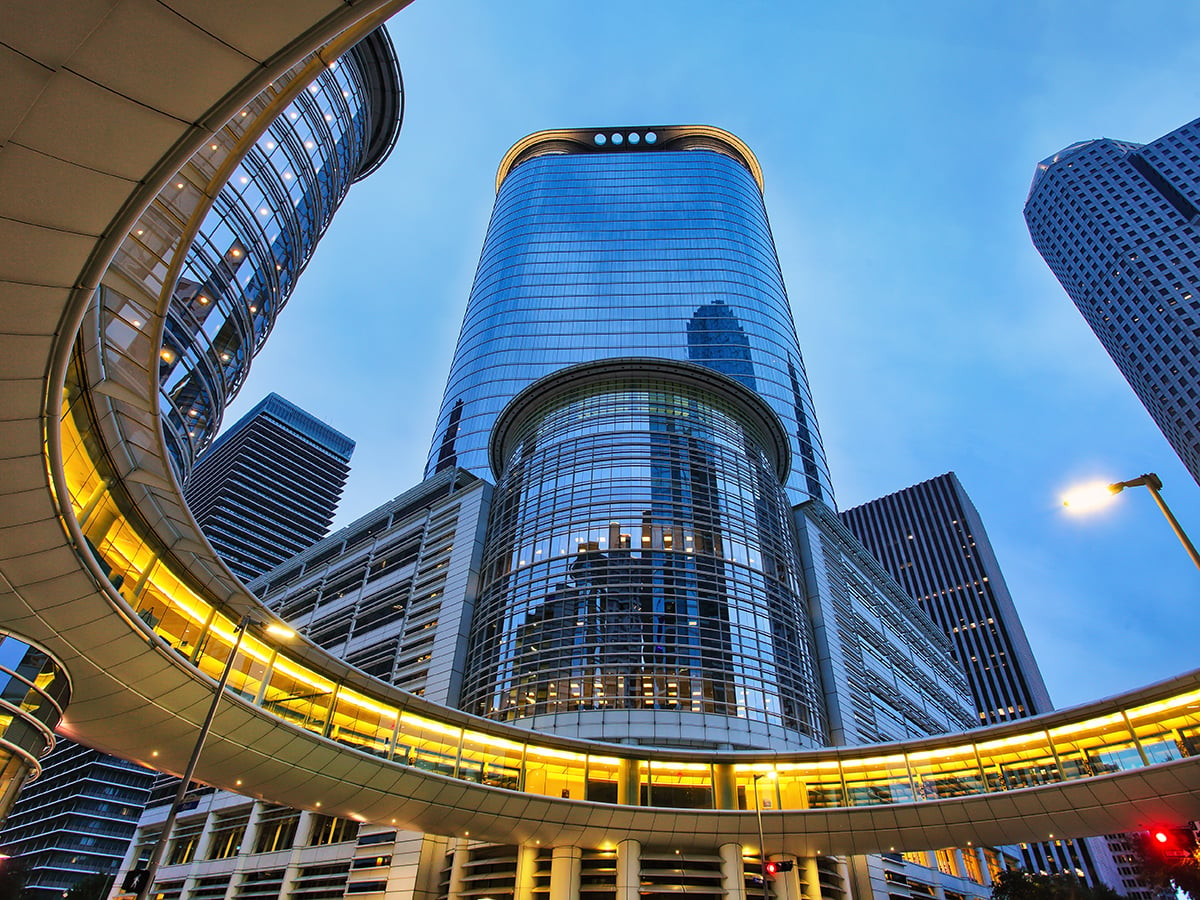
Houston showed early signs of pricing stabilization, with the average sale price increasing to nearly $149 per square foot in 2026, following several years of declines. However, Houston’s prices as of September were still 33 percent below 2019 levels.

You must be logged in to post a comment.