

Seattle’s Office Construction Lags, Vacancy Grows
The market started the year in low key, according to Yardi Matrix information.
Seattle’s office market saw little growth in the beginning of this year, according to Yardi Matrix information. The metro continued to post the thinnest development pipeline among gateway markets, while vacancies remained elevated and asking rates edged down year-over-year.
Once again, the metro registered the highest office vacancy rate among the top 25 U.S. markets in January. As for development, Seattle lagged behind its peers, with only a small amount of competitive space underway at the end of the year.
On the plus side, this year Seattle started to lean more on policy changes than metric improvements to reshape its office landscape. The city approved a sale and use tax deferral for converting underused commercial buildings into housing, a move intended to make downtown office-to-residential deals easier to finance and, over time, pull older Class B and C space out of inventory.
Construction activity behind all gateway peers
Seattle’s office development pipeline comprised almost 253,000 square feet of competitive space at the end of last year. This accounted for 0.2 percent of the metro’s total stock, half the national threshold.
The metro had the smallest development pipeline share among gateway markets. Boston (1.7 percent) and Miami (1.5 percent) topped the charts. When also taking into account planned projects, Seattle’s share out of total stock reached 0.7 percent, while the national average amounted to 1.7 percent.
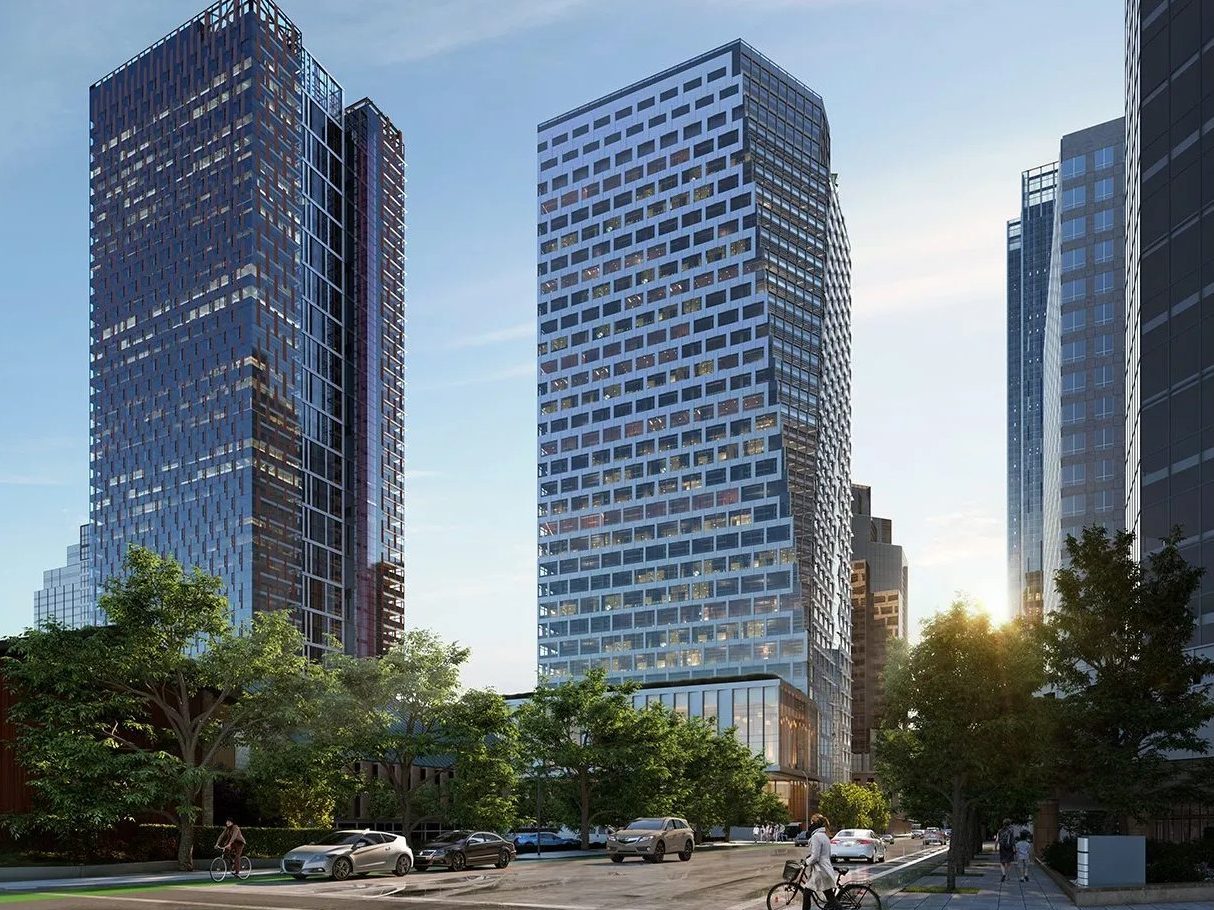
However, a massive owner-occupied development recently reentered the Emerald City’s pipeline as Amazon resumed work on Tower 1 at Bellevue 600, after having put construction on hold in 2022. Designed by NBBJ, the high-rise will rise 43 stories and total 1 million square feet. Bellevue 600 is one of the projects that will reshape Seattle when complete.
As for office completions, five properties came online in the metro last year, totaling 1.1 million square feet. These deliveries accounted for 0.6 percent of stock, marking a 74 percent year-over-year decrease.
The largest project that reached completion in 2025 was Four 106, a 484,700-square-foot office building in Bellevue, Wash., developed by Patrinely Group and Dune Real Estate Partners. The joint venture completed it by using funds from a $270.5 million loan issued by Blackstone Group.
Highest office vacancy in the U.S.
The availability of Seattle office space remained the highest in the U.S., as the market was unable to absorb the 4 million square feet that entered its inventory in 2024. In January, the vacancy rate clocked in at 27.1 percent, marking a 70-basis-point increase year-over-year. The figure was well above the U.S. average of 18.2 percent. Manhattan (13.1 percent) was at the opposite pole, followed by Miami (13.9 percent).
The market’s average listing rate also showed a year-over-year decline in January. Seattle’s figure dropped to $34.91 per square foot, marking a 2.8 percent decrease, but still remained above the $32.55 national average.
The rate was also the smallest among gateway markets. Manhattan led one again, with $67.36 per square foot, followed by San Francisco ($63.84) and Miami ($56.03).
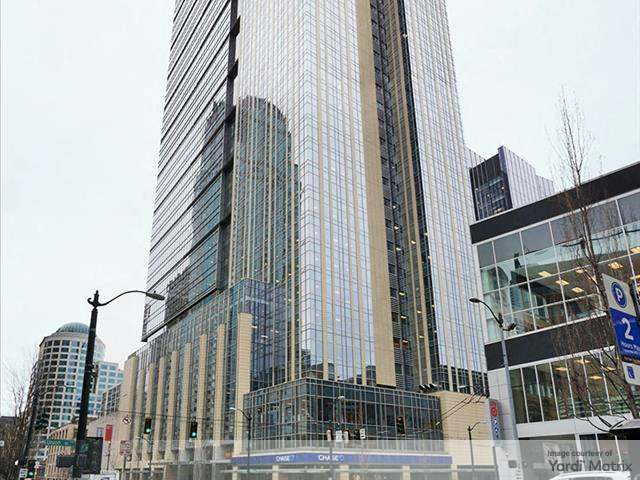
In one of Seattle’s largest office leases of January, JPMorgan Chase & Co. expanded its presence at 1301 Second Ave. in downtown Seattle. The company added more than 40,000 square feet at the property, committing to a total of 128,000 square feet. CommonWealth Partners owns the 42-story tower.
Seattle office sales see slight improvement
After having ended 2025 with the smallest sales volume among gateway markets (at $779 million), Seattle recorded $84 million in office investments in January, surpassing several peers such as Los Angeles ($63 million), Boston ($61 million) and San Francisco ($44 million). Manhattan registered the largest sales volume in the country in January, at $1.3 billion. Miami ($506 million) and the Bay Area ($359 million) rounded out the top three.
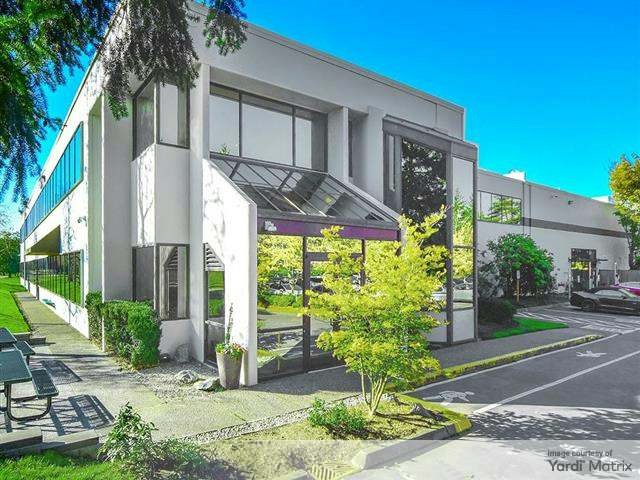
One of Seattle’s traded assets was Redstone Corporate Center I, a 202,273-square-foot building in Lynwood, Wash. Felton Properties paid $48.5 million to Westport Capital Partners for the six-story property. The price translated into almost $240 per square foot.
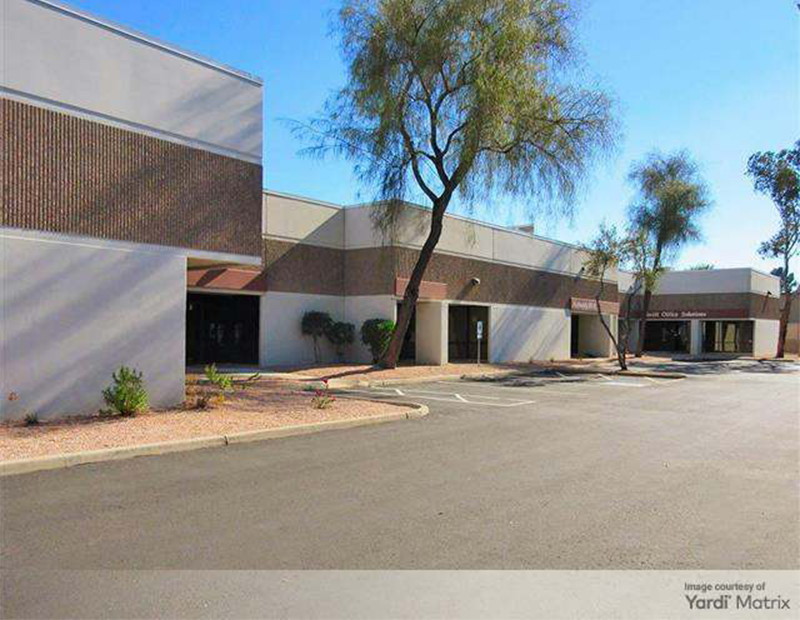
Another one was Marymoor Technology Center in Redmond, Wash. Google purchased the asset for $35.3 million after having leased it for several years. The mid-rise traded for about $445 per square foot.
The properties changed hands for $297 per square foot on average, a price tag almost $20 above the national figure. The market remained one of the most affordable among peers, third to last ahead of Boston ($207 per square foot) and Houston ($63 per square foot). San Francisco was the most expensive one in January, the average per-square-foot price reaching $1,088.
Seattle’s slowly growing coworking footprint
Seattle’s coworking footprint totaled 3.3 million square feet across 168 locations in January, according to CoworkingCafe, up 6.5 percent from the flex office amount included in our previous market update. The square footage represented 2.1 percent of the metro’s overall office inventory, just below the 2.2 percent national average.
Among gateway peers, Seattle landed in the low end of the ranking, having surpassed only Washington, D.C. (1.9 percent). Miami posted the highest coworking share at 4.1 percent, while Manhattan and Los Angeles were tied for second place at 2.5 percent.
Regus remained the largest flex office operator in the metro, with 593,739 square feet across 29 locations. It was followed by extraSlice (300,212 square feet) and WeWork (290,979 square feet).


You must be logged in to post a comment.