The Case for CRE in Today’s Pricing Environment
How real estate cap rates are faring in comparison to other benchmark yields.

Private real estate valuations, especially within the ODCE universe of core, open-end funds, have come under heightened scrutiny in the current cycle. Many market participants argue that reported values have lagged true market pricing, with appraisals slow to adjust to a higher interest rate environment. This dynamic has left many core assets valued at what appear to be artificially low cap rates, limiting transaction activity and delaying a true market-clearing process. However, as we progress through the cycle the picture has become more nuanced, where the very repricing that has weighed on sentiment may be setting the stage for renewed opportunity.
Using the NCREIF Property Index benchmark of unlevered returns on operating properties, values have declined just under 20 percent from their peak in Q2 2022. (NPI is down 19.5 percent through Q2 2025, though the declines vary substantially by sector: down 9 percent for retail, 12 percent for industrial, 16 percent for multifamily, and 38 percent for office.) Over the past four quarters, valuations have been flat to slightly positive across most sectors. In prior cycles, similar patterns have often been viewed as signaling a potential entry point, given the cyclical nature of private market valuations and the tendency for momentum to build once a trough has been established. A primary concern among investors today, however, lies in relative pricing versus fixed income. The most common comparisons in the industry are between real estate cap rates and yields on the 10-year Treasury and Baa corporate bonds. In the current elevated rate environment, these spreads remain compressed. For example, the spread between the NPI cap rate and the Baa corporate bond yield has averaged 50 basis points since Q4 1999 but currently stands at negative 32 basis points.
LIKE THIS CONTENT? Subscribe to the CPE Capital Markets Newsletter
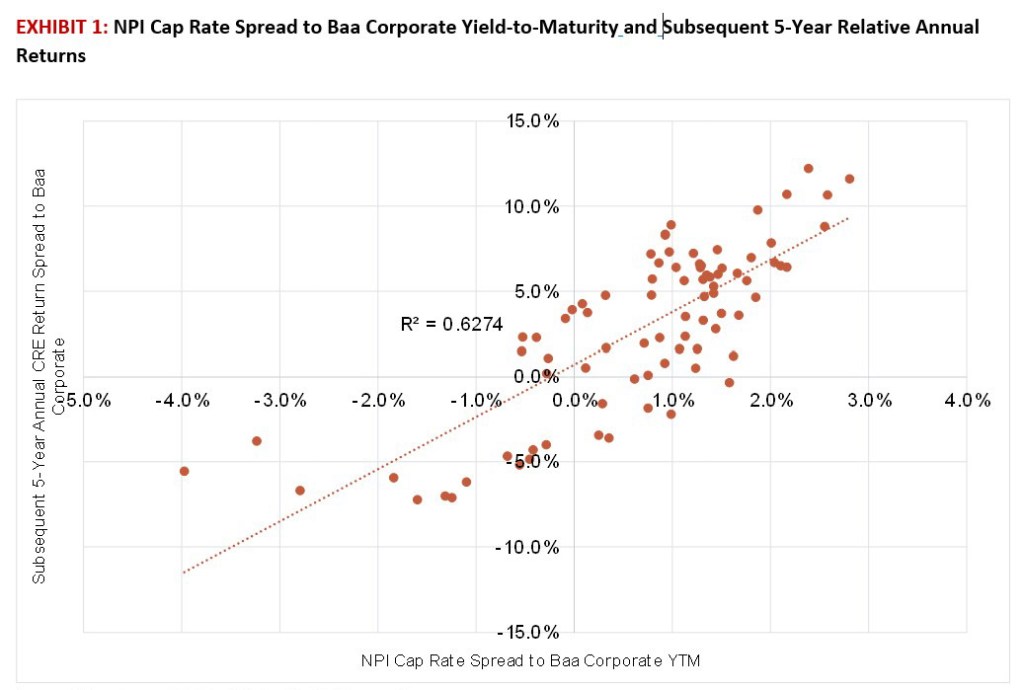
Historically, the spread between NPI cap rates and Baa corporates has been indicative of future relative performance, as shown in Exhibit 1:
- The scatterplot shows the spread between NPI cap rate and Baa corporate yield-to-maturity (YTM) for each quarter from Q4 1999 to Q2 2025 on the x-axis, and the five-year annualized spread of NPI returns minus Baa corporate bond index returns on the y-axis.
- The series demonstrates a strong relationship going back to Q4 1999, with an R-squared of 0.63. (R-squared measures the proportion of variance in a dependent variable that is explained by an independent variable or set of variables in a regression model. Values range from 0 to 1, with higher values indicating that the model explains a greater share of the observed variation.) This suggests that the relative difference in current pricing is indicative of relative return performance between NPI and Baa corporate bonds.
The fact that cap rate spreads are tight is at least partially justified in the current environment. Private real estate should warrant relatively tighter cap rate spreads to bond yields in the current environment. Inflation expectations, while moderating from peak levels, remain above pre-pandemic norms, and the risks of renewed inflation are elevated given geopolitical fragmentation and supply chain realignments. Against this backdrop, the static nature of fixed-income cash flows appears relatively less attractive, as bonds provide no protection against upside surprises in inflation.
By contrast, commercial real estate offers a partial hedge, as rent and net operating income growth respond to inflationary pressures, and as construction materials and labor costs rise, replacement costs increase, supporting asset values. These characteristics suggest that CRE provides some participation in inflationary upside, unlike fixed income, which is capped at contractual yields. As a result, spreads between real estate cap rates and bond yields might reasonably be narrower than has been the case over the past 25 years in a more muted inflation period. These effects materialized in the recent elevated inflationary period, as same-store NOI for the NPI index has been 4.9 percent annually since the beginning of 2022 despite the valuation declines versus the average of 2.8 percent in the 20 years ending Q4 2019.
In addition to accounting for inflation, a more comprehensive assessment requires situating private real estate relative not only to specific classes of fixed income, but also to higher yielding bonds and equities. These asset classes all compete for institutional capital, yet each carries distinct exposures to growth, inflation and volatility. In the paragraphs below, we broaden the lens to examine how real estate compares to a high-yield bond index and stocks, placing current valuations in a fuller relative-value context.
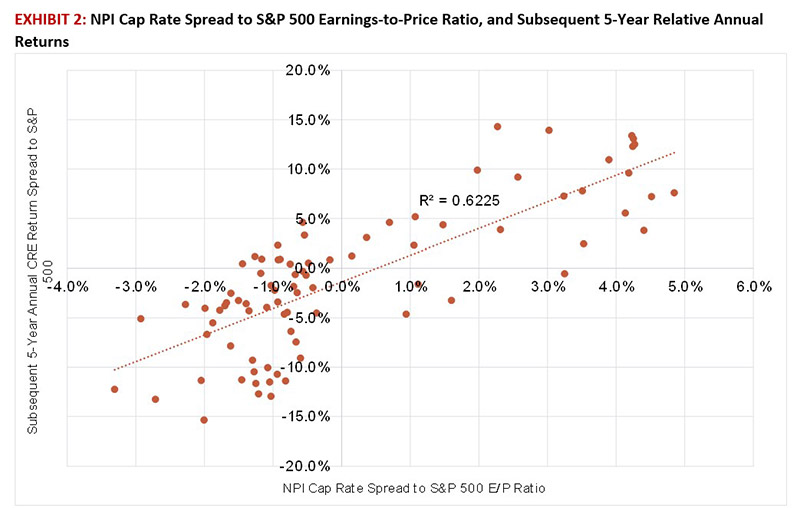
For equities, we compare the relationship of NPI cap rates to S&P 500 earnings-to-price ratio. While real estate property values are down 20 percent from their 2021/22 peak levels, the S&P 500 is up 38 percent over the same period. Valuations are elevated today compared to historical norms, with the adjusted P/E ratio at 25.3, the highest levels since before the “dot.com” bubble burst in 2001. The historical relationship of the spread between NPI cap rates and S&P 500 E/P ratio has been similarly predictive of future relative performance between the two asset classes, as shown in Exhibit 2, with an R-squared of 0.62, nearly identical to the relationship between NPI and Baa corporates demonstrated in Exhibit 1.
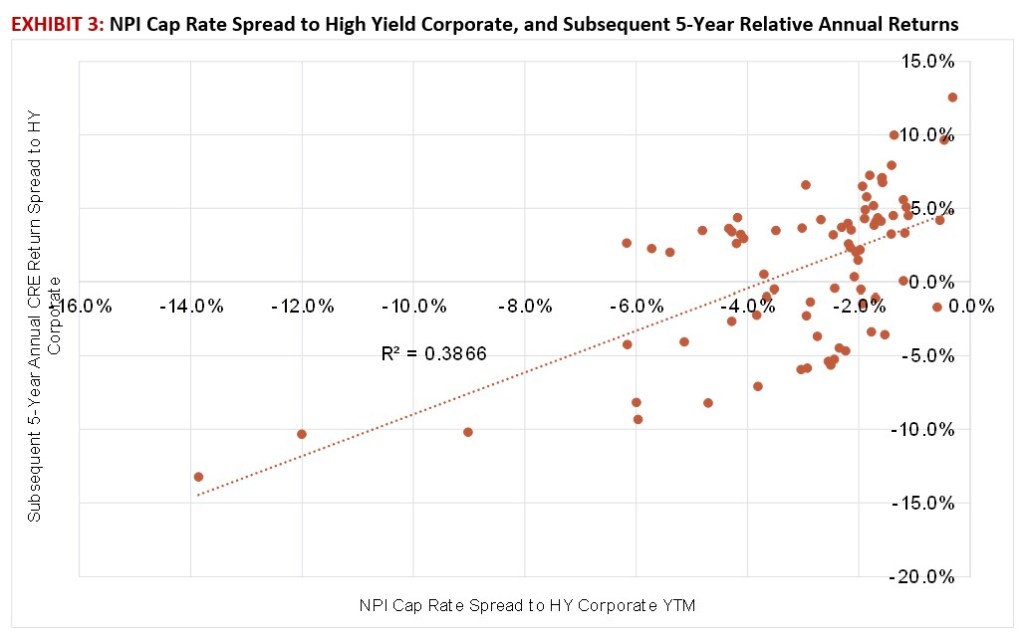
Turning to high-yield bonds, we evaluate the relationship between NPI cap rate spreads and the yield-to-maturity on the Bloomberg high-yield bond index. Similar to the analysis with Baa corporates, the spread has historically provided insight into subsequent relative performance between commercial real estate and high-yield debt. While the relationship is somewhat less pronounced, with an R-squared of 0.39, it remains statistically meaningful, as shown in Exhibit 3.
Implications for relative performance
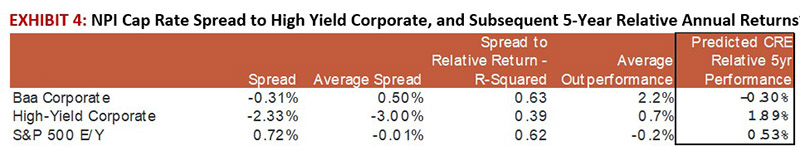
Taken together, these relationships provide a broader perspective on where real estate sits in the current capital markets landscape. While NPI cap rates are indeed priced tight to Baa corporate bonds on a historical basis, they appear relatively attractive when measured against high-yield corporates and the S&P 500. As summarized in Exhibit 4, spreads to both of these asset classes are wide compared to long-term averages, suggesting favorable entry points. Based on the historical linkage between spreads and subsequent returns identified in the analysis above, and using current spreads to project future relative returns, this positioning implies that commercial real estate is well situated to deliver outperformance relative to high-yield bonds and equities over the next five years.
In sum, while private real estate valuations have lagged broader market adjustments over the past few years, particularly relative to traditional fixed income benchmarks, pricing in the private sector now appears more aligned on a relative basis. Spreads to certain fixed income benchmarks remain compressed, but when viewed against higher-yielding credit and equities, the pricing of core real estate appears more favorable than headline comparisons might suggest, and value creation strategies are even more favorably positioned. Coupled with signs of an improving capital markets environment, ranging from stabilizing interest rates to gradually thawing transaction activity, these dynamics position private real estate to deliver strong relative performance as the cycle moves into its next phase.
Mark Fitzgerald is executive director & head of North American research for Affinius Capital.