

Top Markets for Office Transactions in H1 2022
These cities attracted the highest deal volume during the first half, according to CommercialEdge.
![]() The office market volatility following the global health crisis has somewhat decreased in 2022, while investor confidence is stabilizing. Hybrid working models have reduced demand for traditional office space and within stabilized, gateway cities, the development pipeline has gradually been shrinking, slowly shaping the sector’s next phase.
The office market volatility following the global health crisis has somewhat decreased in 2022, while investor confidence is stabilizing. Hybrid working models have reduced demand for traditional office space and within stabilized, gateway cities, the development pipeline has gradually been shrinking, slowly shaping the sector’s next phase.
In the first half of 2022, national office sales reached $37.46 billion, marking a $3.13 billion expansion on a year-over-year basis, according to CommercialEdge data. While overall, investment activity picked up pace nationwide, the largest increase in deals signed was across Class B properties, which recorded a 29.7 percent increase since mid-2021. The sale of Class C assets was up 20.5 percent, while Class A deal volume registered the lowest increase: 4.7 percent.
Some markets drove activity, such as Boston, the Bay Area and Seattle, where the life sciences sector saw increased demand. The office market has also recovered rapidly in high-growth Sun Belt cities like Austin and Phoenix. Gateway cities that hold a large existing office supply occupy leading positions on our list for top office markets for transaction activity in the first half of the year, based on data from CommercialEdge. Here’s our list of the top markets for office transaction activity during the first half of 2022:
| Rank | Market | Sales Volume H1 2022 | Price Per SqFt H1 2022 | Price Per SqFt H1 2021 |
| 1 | Los Angeles | $2,507,386,500 | $485.49 | $355.60 |
| 2 | Bay Area | $2,378,139,000 | $497.01 | $495.32 |
| 3 | Boston | $2,372,446,151 | $408.55 | $437.36 |
| 4 | Washington DC | $2,001,979,033 | $292.69 | $246.38 |
| 5 | Seattle | $1,752,799,101 | $633.67 | $460.02 |
| 6 | Chicago | $1,646,135,521 | $196.18 | $203.82 |
| 7 | Manhattan | $1,574,530,192 | $844.75 | $1,056.41 |
| 8 | New Jersey | $1,521,396,875 | $272.25 | $163.26 |
| 9 | Denver | $1,516,337,851 | $317.21 | $226.97 |
| 10 | Phoenix | $1,484,443,010 | $282.49 | $206.99 |
5. Seattle
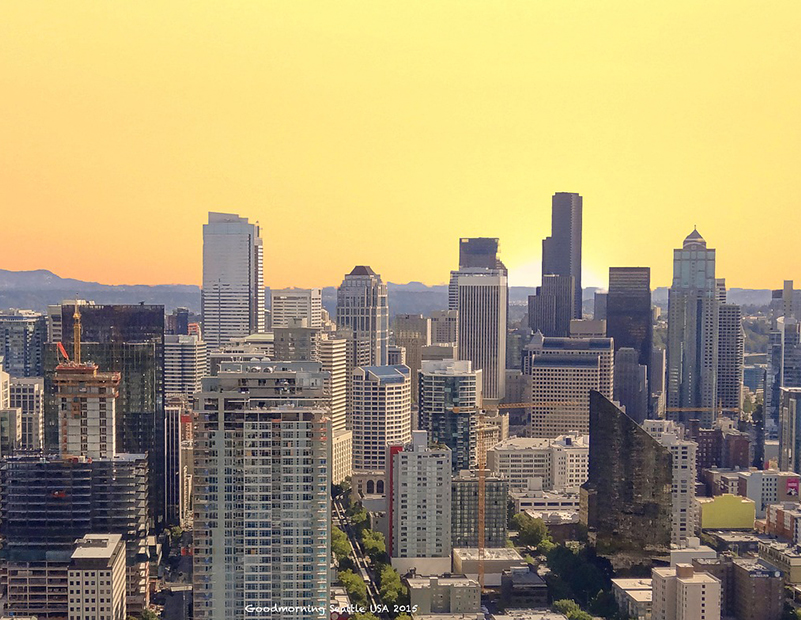
Seattle. Image by Lars Kristiansen from Pixabay
Seattle’s tech sector has kept the city’s office investment market active. In the first six months of the year, office deals in Seattle amounted to $1.8 billion, up nearly 9 percent compared to the same period last year. The average sale price per square foot was the second largest across top ten markets for investment activity after Manhattan, reaching $633.7.
While the Seattle market’s overall dollar volume transacted in the first six months grew on a year-over-year basis, the actual square footage sold in the first half of 2022 reached 3.6 million square feet, down 780,000 square feet since the same period in 2021. Sale volume was up across all asset classes since mid-2021 levels, but Class C assets registered the largest, 366 percent increase in sale volume for the first half of the year. Prices were up compared to mid-2021, when they averaged at $460.0 per square foot.
In February, Deka Immobilien paid $802 million—or more than $1,260 per square foot—for a Google-anchored office property in the metro’s South Lake Union submarket. The 635,000-square-foot asset was finalized in 2019. The two residential towers that sit atop the office component were not part of the deal.
4. Washington, D.C.
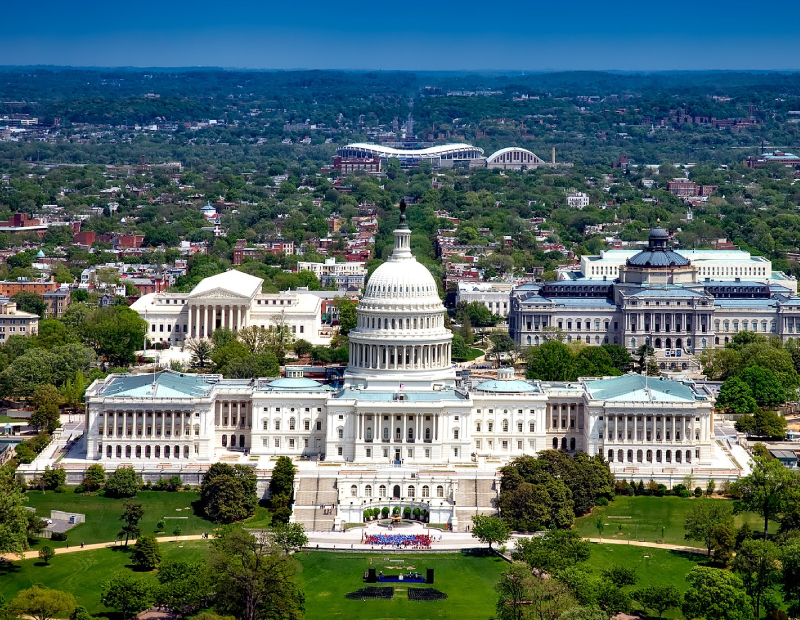
Washington, D.C. Image by David Mark via PIxabay.com
Washington., D.C. is the first market on our list to exceed the $2 billion-mark in office sales in the first six months of 2022. Sales added up to 7.9 million square feet that changed hands. The metro’s overall office transaction total nearly doubled since 2021, expanding by $1.1 billion compared to the first half of the previous year. Significant growth has been recorded across all asset classes.
The metro is one of the least expensive on our top 10 list, along with Chicago ($196.2 per square foot), New Jersey ($272.3 per square foot) and Phoenix ($282.5 percent). The average price for office assets in Washington, D.C. reached $292.7 per square foot, up $46.3 since mid-2021.
In June, Post Brothers bought into the Washington, D.C. office market with the acquisition of two Class B buildings. As part of the company’s transition to a focus on multifamily and its signature National Landing project, JBG SMITH sold off the asset for $228 million. Spanning a full city block, Universal North and South comprise a total of nearly 660,000 square feet.
3. Boston
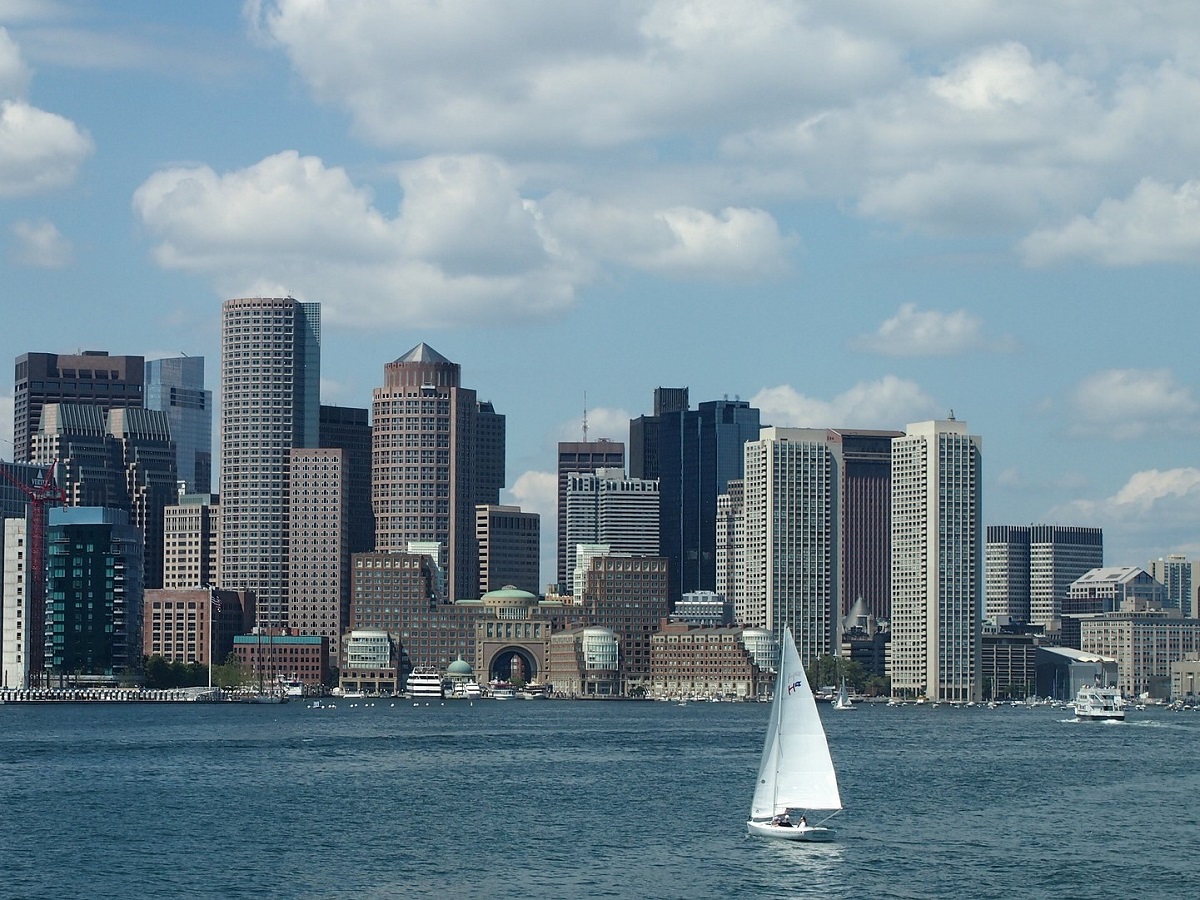
Boston. Image by Andreas Hundt via Pixabay
One of the biggest life sciences hubs, Boston’s office market has seen an impressive recovery during the past year. With high-quality space hitting the market, the average listing rate in June was up by 12.0 percent on a year-over-year basis. The same month, Boston was the only market to have an office vacancy rate below 10 percent.
The metro’s office transaction volume for the first half of 2022 hit $2.4 billion, up roughly $51.3 million since the same period in 2021. Pointing toward a more stable market, the gain in deal volume was less spectacular than in the markets mentioned above. The average sale price hit $408.6 per square foot, down $28.8 since the first half of last year.
In the beginning of the year, Alexandria Real Estate Equities Inc. picked up a 1.3 million-square-foot office campus in Andover, Mass. Atlantic Management and Spear Street Capital were the sellers of the eight-building office, R&D and laboratory ensemble in Minuteman Park, which traded for a total of $341 million.
2. Bay Area
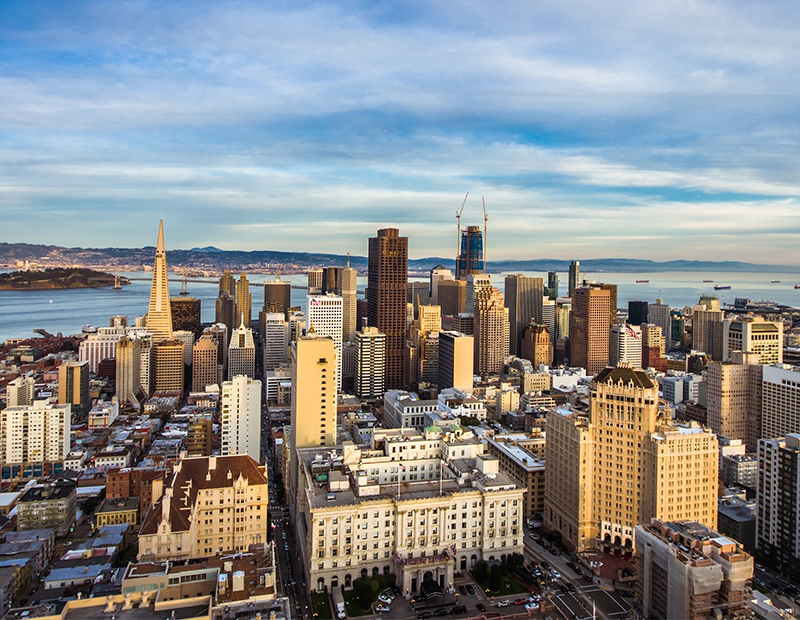
Bay Area. Image courtesy of Pixabay.com
The San Francisco Bay Area’s unmatched tech hub and life science sector has, to some degree, provided a protective shield against pandemic-induced woes faced by traditional office space. The metro is one of the top markets for office construction, with vacancy improving at a steadier pace than in the Peninsula.
The East and South Bay’s sales volume in the first half of the year reached $2.4 billion, down roughly $1 billion since the same period last year. This drop in investment volume year-over-year was atypical, as most U.S. markets registered increases over the last 12 months, the only other exception being Manhattan (-$289.13 million). The average price for office product in the Bay Area was stable since mid-2021 and reached $497 per square foot in June.
Transaction volume decreased across all asset classes compared to the first six months of 2021. Prices decreased for B Class assets from $369 per square foot in the first half of 2021 to $282.9 in the same period in 2022. The average price for Class A properties inflated the most, from $684.2 per square foot in 2021 to $1,038.5 in the first six months of 2022.
1. Los Angeles
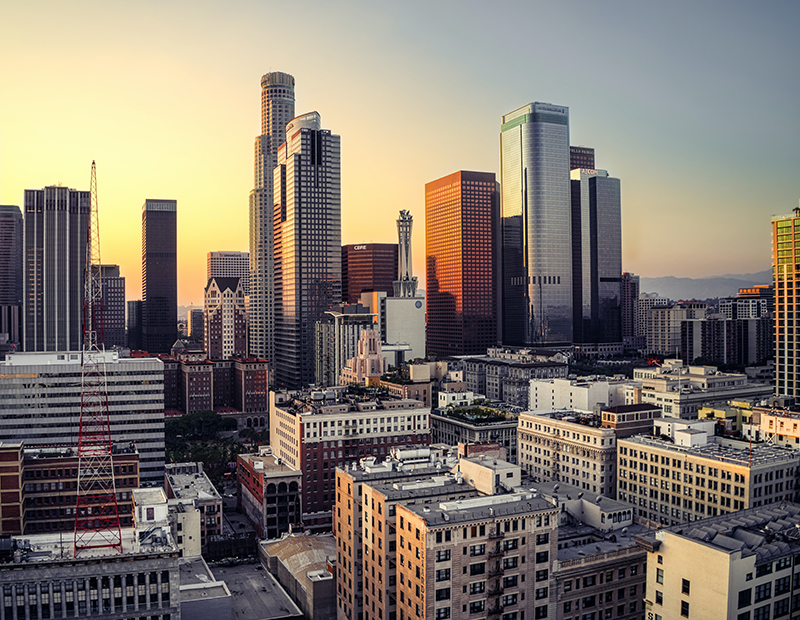
Los Angeles. Photo by Cameron Venti via Unsplash.com
In mid-2022, the Los Angeles metro’s office pipeline relative to existing office stock was one of the lowest in the country, but the City of Angels was the nation’s busiest market for office transactions. The sales volume for the first six month of the year reached $2.5 billion and nearly doubled compared to the same period in 2021. The actual square footage that changed hands in the first half of the year—5.22 million square feet—was also significantly higher than last year, when it added up to 3.48 million square feet.
Prices in L.A. have also increased, from an average of $355.6 per square foot recorded in the first six months of 2021 to $485.5 per square foot year-to-date through June 2022. Average transaction prices were up across Class A and Class B assets since mid-June last year, but for Class C properties, prices decreased year-over-year from $512.9 in 2021 to $271.4 in the first six month of the year.
In June, a subsidiary of FS Credit Real Estate Income Trust Inc. picked up 555 Aviation, a nearly 300,000-square-foot creative office property in El Segundo, Calif. Tishman Speyer sold the single-story, LEED-certified asset for $205.5 million. Built in the 1960s, the property went through a compete overhaul in 2018. At the time of the sale, the building was fully leased to three tenants.
CommercialEdge covers 8M+ property records in the United States.
You must be logged in to post a comment.