Top 5 Markets for Office Transactions
Investment volume in these cities neared $7 billion, more than 30 percent of all national sales, according to CommercialEdge data.
The office sector has witnessed a notable decline in investment activity, marked by a substantial drop in sales volume year-to-date through October, CommercialEdge data shows. This overarching trend is evident in key markets and, despite varying degrees of resilience, these share a common thread of decreased office transaction volumes, with figures down by significant percentages compared to the previous year. Factors contributing to this downturn include the lingering impacts of the pandemic, evolving remote work trends and economic uncertainty.
Some $22.1 billion worth of office assets across 155.9 million square feet changed hands in the U.S. year-to-date through October. Sales volume recorded a 67.6 percent drop from the same period of 2022, when the transaction volume exceeded $68.2 billion, and a 69.3 percent decline from 2021 values, when a total of $72.1 billion worth of office assets changed hands.
The metros on our list represent the top-performing markets for office transactions across the nation, based on CommercialEdge data. Transaction volume in these markets amounted to nearly $7 billion, or 31.5 percent of the national sales volume.
1. Manhattan
Manhattan's strong performance in the office sector highlights its status in a changing market. Office sales in the borough surpassed $1.7 billion year-to-date in October, encompassing 3.4 million square feet across 21 properties. This reflects a substantial 66 percent decrease compared to the same time last year, when 26 properties encompassing 6.6 million square feet had been sold for a total of $5 billion.
This year’s values also mark a notable decline from the nearly $5 billion registered during the same period in 2021, when 25 properties totaling 5.9 million square feet changed hands. Despite the decrease in sales volume, Manhattan sustains an impressive average price of $579.62 per square foot. However, this figure remains below the averages of the preceding years, notably lagging behind the $874.21 per square foot recorded in 2022 and the 2021 average of $1,203.57 per square foot.
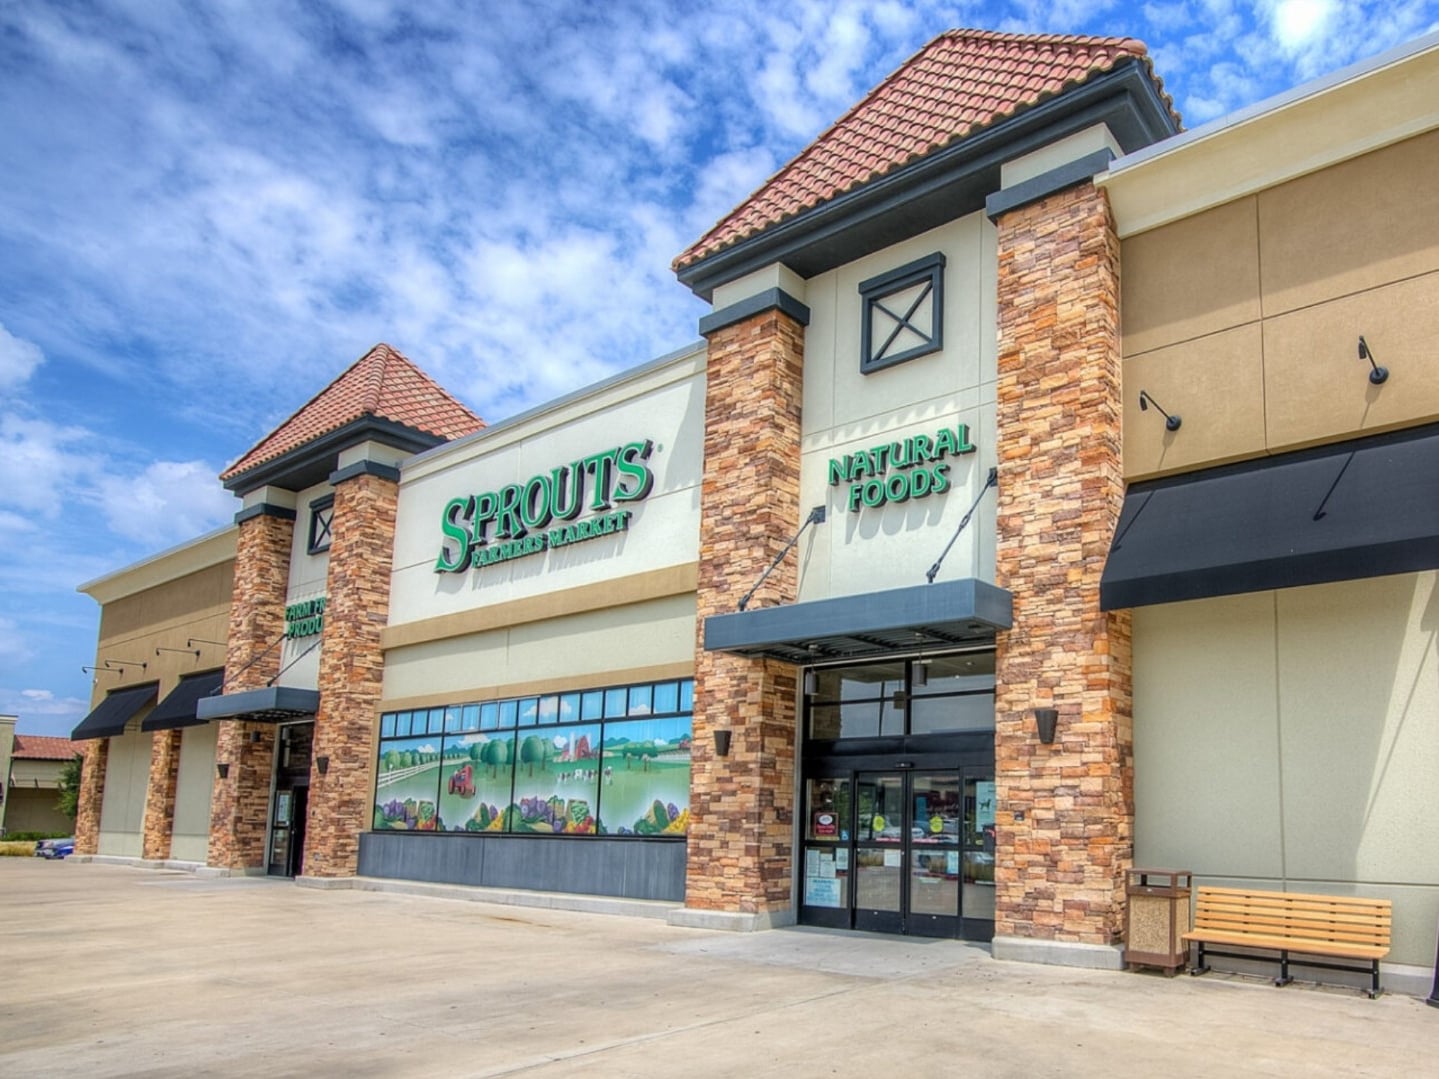
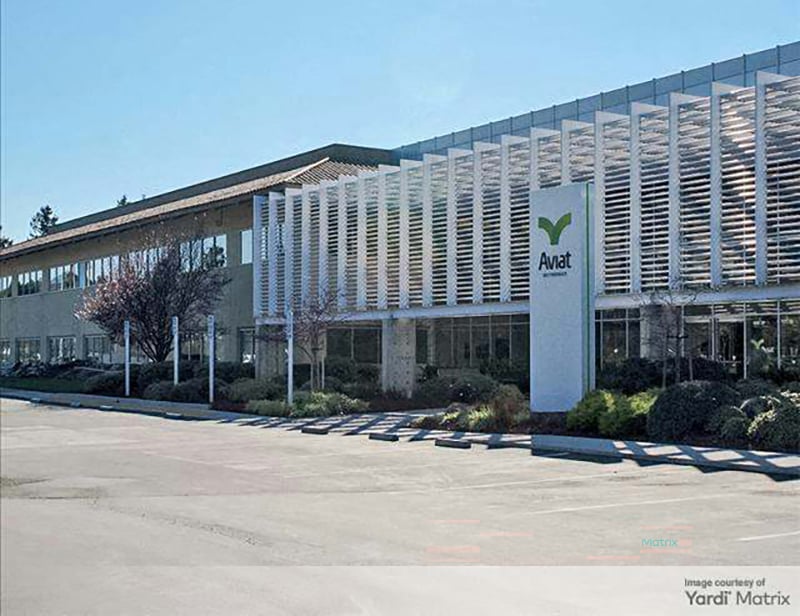
2. Los Angeles
Despite a slower investment performance, Los Angeles secured the second spot in our rankings. Between January and October 2023, transaction volume in Los Angeles exceeded $1.4 billion, involving 7.2 million square feet across 60 properties. This figure indicates a 56.3 percent decrease when contrasted with the same period of 2022. Specifically, during the same timeframe last year, 98 properties spanning 7.8 million square feet traded for a total of $3.2 billion.
Office investment year-to-date in 2023 decreased by 46.2 percent when compared to the $2.6 billion recorded during the first ten months of 2021, encompassing 95 properties totaling 7.1 million square feet. Meanwhile, the average sale price for office properties stood at $285.36 in October, CommercialEdge data shows. This accounts for a 35.1 percent decline from 2022 values, when office assets traded at an average of $439.94 per square foot, and 26.3 percent less than the $387.05 per square foot recorded in 2021.
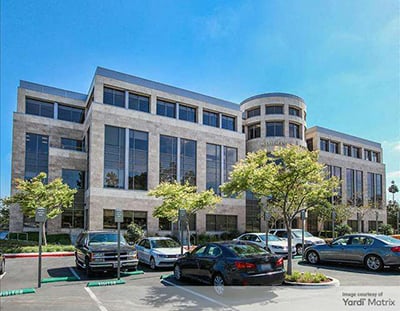
3. Washington, D.C.
Over the first ten months of 2023, a total of 68 properties amounting to 7.4 million square feet changed hands in Washington, D.C., generating a combined value of $1.4 billion. This marks a significant 68.9 percent decrease compared to the $4.5 billion worth of assets sold during the same period in 2022, when 136 properties totaling 16.4 million square feet traded.
Additionally, office transaction activity in 2023 recorded a 53.3 percent drop from the $3 billion recorded in 2021, involving 86 properties covering 11.7 million square feet. As of October, the average sale price for an office property was $219.37 per square foot, marking a 24.6 percent decline from the $290.84 per square foot reported in 2022 and a 24 percent decrease from the $288.84 recorded in 2021.
4. Boston
Boston's office investment activity continued to be propelled by the resilience of its booming life science market. As of October, sales volume in Boston was just over $1.3 billion, involving 42 properties totaling 4.8 million square feet. This indicates a 76.4 percent decrease from the $5.5 billion recorded during the first ten months of 2022, when office sales comprised 96 properties featuring 11.2 million square feet.
This year’s investment volume decreased by 74 percent when compared to the $5 billion registered during the same timeframe in 2021, when 86 properties totaling 15.7 million square feet changed ownership. Office assets traded at an average of $307.94 per square foot, representing a 47.4 percent decrease compared to the $585.13 per-square-foot average of 2022. The value is 24.5 percent smaller than the average recorded in 2021, which stood at $408.14 per square foot.
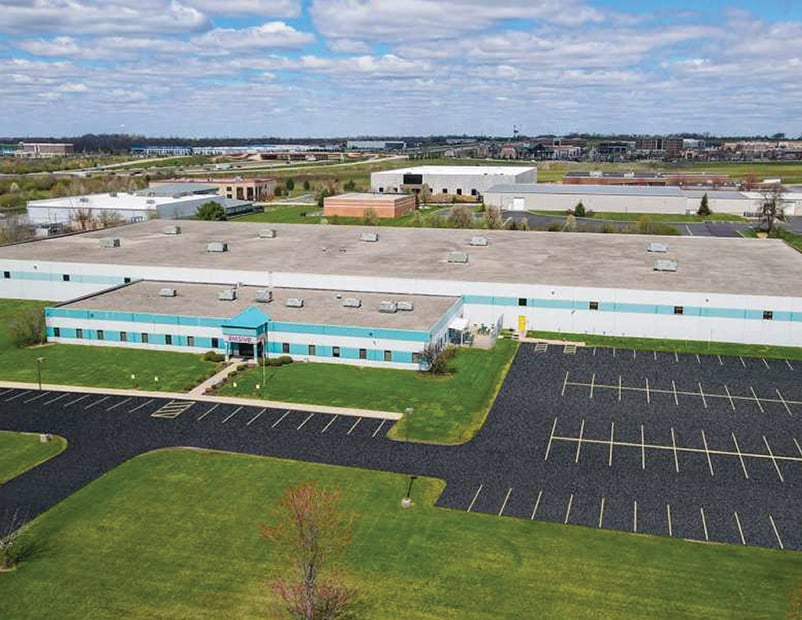
5. New Jersey
Transaction activity year-to-date as of October amounted to $1.1 billion in New Jersey, where approximately 8.4 million square feet of office space changed hands across 53 properties. This is a 63.3 percent decline in office investment compared to the same period in 2022, when 105 properties totaling 14.1 million square feet changed ownership for $3 billion.
The sales volume for this year also reflects a 35.3 percent drop when compared to the first ten months of 2021, during which 89 properties encompassing 12 million square feet were sold for $1.7 billion. At the same time, the average sale price for an office property was $151.05 per square foot, indicating a 37 percent decline from the 2022 average of $239.77 per square foot. However, this figure is closely aligned with the 2021 average of $157.87 per square foot.