

These Markets Top MOB Investment Activity
Plus, the latest update on deals, rents and cap rates from CBRE.
Phoenix was the top market for trailing-four-quarter MOB investment volume in the first quarter of 2024 with $373 million, followed by Atlanta with $366 million and Greater Washington, D.C., with $346 million but overall investment activity dropped 21 percent from the previous quarter to $1.6 billion, according to a new CBRE report. The decrease brought the trailing-four-quarter total to $7 billion.

In a little bit of good news for the sector, MOBs sold for an average of $288 per square foot in the first quarter, up by $1 from the fourth quarter. While only a small step up, it was the first increase in the past six quarters, the brokerage firm’s U.S. Medical Outpatient Buildings report for the first quarter of 2024 stated.
CBRE also noted 13 of the top 20 markets for investment volume saw year-over-year increases. However, high interest rates and inflation continue to impact MOB investment activity. On a quarter-over-quarter basis, markets were evenly split, with 10 seeing increases and 10 marking decreases.
READ ALSO: Medical Office to Perform Well
That split was even starker in the top 10 markets with only sixth-place Tucson, Ariz., (up 122.4 percent) and 10th place Houston (up 167.7 percent) registering increases. Top market Phoenix saw a 7.9 percent decrease in MOB investment volume followed by second-place Atlanta down 70.8 percent; third-place Washington, D.C., down 91.5 percent; fourth-place Los Angeles down 88 percent; fifth-place Chicago down 44.8 percent; the seventh-place Northern New Jersey market down 39.6 percent; eighth-place Boston down 70.8 percent and ninth-place Seattle down 85.2 percent.

On a regional basis, CBRE reported the Midwest was the top region for first-quarter investment volume with $462 million, followed by the Southwest with $393 million. CBRE tracked a total of 185 transactions in the first quarter. While the Midwest has the highest investment volume by dollar figure, the Southeast had the highest number of transactions at 58, compared to 42 for the Midwest.
The high interest rate environment and ongoing inflation has resulted in increased cap rates for most commercial real estate asset types and MOBs are no exception. The average MOB cap rates have increased for six consecutive quarters, ending the first quarter at 7.0 percent versus 7.4 percent for traditional office buildings, according to CBRE. The average MOB cap rate had steadily declined between 2020 and mid-year 2022 before increasing by 90 basis points between the third quarter of 2022 and the first quarter of this year.

Rent and absorption
MOB asking rent growth has far outpaced traditional office buildings since 2020, primarily due to increased demand for health-care services. MOB rent growth ticked up in the first quarter of this year, remaining at 6.5 percent above its first quarter of 2020 level, compared with 0.8 percent growth for traditional office space, CBRE reported. The average MOB asking rent reached a record $24.70 per square foot in the first quarter of 2024, a 0.5 increase from the fourth quarter of 2023. Markets with the greatest year-over-year rent increases were Louisville, Ky., up 8.6 percent; Cleveland, up 4.4 percent, and Grand Rapids, Mich., up 4.1 percent.
Development of higher quality MOB inventory is expected to keep asking rents on the rise for the near future, CBRE notes. Absorption should increase significantly going forward as new MOB projects are slated to deliver over the next two years. MOB construction completions totaled 1.7 million square feet and brought the trailing-four-quarter total to 10 million square feet. Vacancy is expected to peak in late 2024 and start falling in 2025 as those high-quality deliveries are absorbed. The average vacancy rate rose by 0.3 percent quarter-over-quarter and 0.9 percent year-over-year to 9.7 percent.
Spotlight on deals
Of the 24 deals listed in the CBRE MOB report, several were featured recently by Commercial Property Executive. In January, Remedy Medical Properties purchased a six-building, 145,308-square-foot portfolio of medical office buildings in Northern Kentucky and the outskirts of Cincinnati from Zalla Cos. for approximately $43 million, according to CBRE. CPE stated all the buildings are leased to St. Elizabeth Physicians, a multi-specialty organization with practices in Kentucky, Ohio and Indiana.
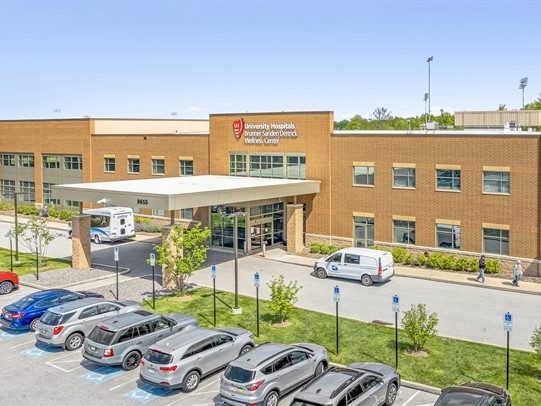
Also in January, the University Hospitals Wellness Campus at 8655 Market St. in Mentor, Ohio, has changed hands for approximately $37 million. Lake Health, part of the University Hospitals Health Systems, occupies the entire two-story, 86,000-square-foot facility.
In May, a joint venture of Remedy Medical Partners and Kayne Anderson Real Estate acquired a 37-property medical office portfolio spanning 13 states and more than 700,000 square feet for $252 million from Broadstone Net Lease. The largest property in the portfolio was the 120,000-square-foot Ridgeway Medical Campus near Rochester, N.Y., that is fully leased to Rochester Regional Health. CBRE reported the 145,308-square-foot asset sold for $43 million.


You must be logged in to post a comment.