Risk Across U.K. Office Assets
October 30, 2017
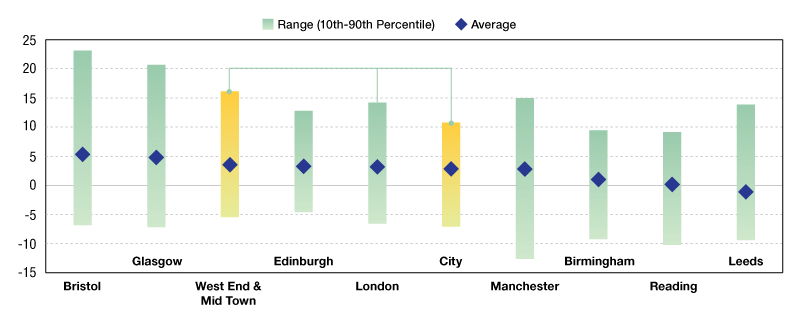
The chart illustrates how much specific risk existed in office assets across a number of U.K. cities during the 12-month period ended June 2017.
comparing average vs. range of returns within cities
The chart illustrates how much specific risk existed in office assets across a number of U.K. cities during the 12-month period ended June 2017. Using analysis from Global Intel PLUS, we are able to compare average returns across cities as well as the range of returns within cities (as measured by the difference between the 90th and 10th percentiles). We see that the range of returns within these cities was, on average, far broader than that of average returns across these cities, 19.4 percent versus 6.4 percent, respectively. Given these results, it is important for investors to consider how risk factors other than sector and geography can impact asset level returns.


You must be logged in to post a comment.