

2019 Solar Market Is Off to the Races
Highlights of solar energy's record-setting 2019 start, plus insights on what's in store for the second half of the year.
Wood Mackenzie and Solar Energy Industries Association have released first-quarter data on solar installations in the U.S., which shows that the solar market in the country has seen its best first quarter in history. The solar industry has surpassed the two million solar installation milestone during this period. The industry is expected to hit 3 million installations in 2021 and 4 million in 2023.
Read Also: NV Energy to Boost Solar Generation, Energy Storage
The U.S. installed 2.7 gigawatts of solar photovoltaics in the first three months of the year, and Wood Mackenzie Power & Renewables forecasts 25 percent growth in 2019 compared to 2018.
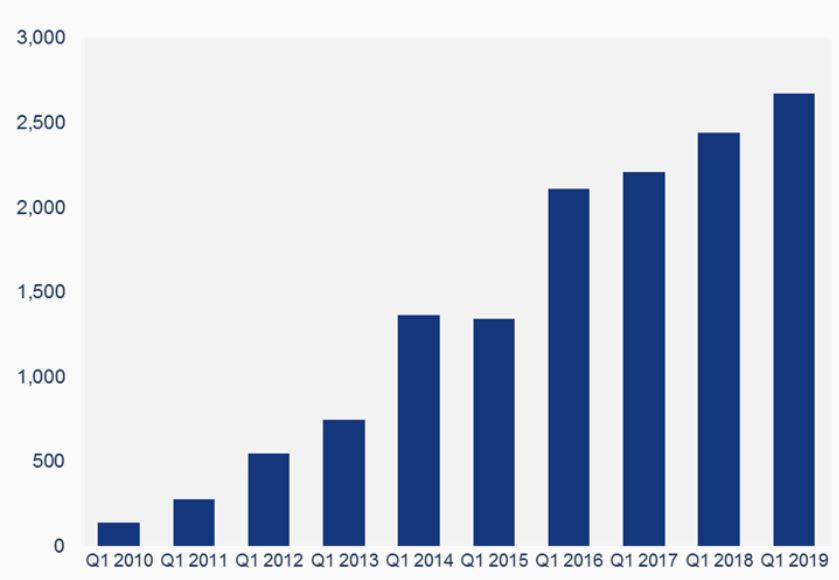
U.S. PV capacity installed in the first quarter, Q1 2010 – Q1 2019 (MWdc). Chart courtesy of Wood Mackenzie SEIA U.S. Solar Market Insight Report
Wood Mackenzie Power & Renewables forecasts a boost of 25 percent in 2019 over 2018 values, while total installed U.S. photovoltaic capacity is expected to more than double over the next five years. The solar photovoltaic installations are projected to reach 16.4 gigawatts DC in 2021, prior to the expiration of the residential federal Investment Tax Credit.
Utility PV
The utility photovoltaic segment led growth with more than 1.6 gigawatts coming online, which makes up 61 percent of photovoltaic capacity installed. Currently, the utility photovoltaic pipeline totals nearly 28 gigawatts. The report authors note that 2019 is on track to be a strong year for utility photovoltaic and forecast a 46 percent growth over 2018, supported by the 4.7GW of large-scale projects under construction.
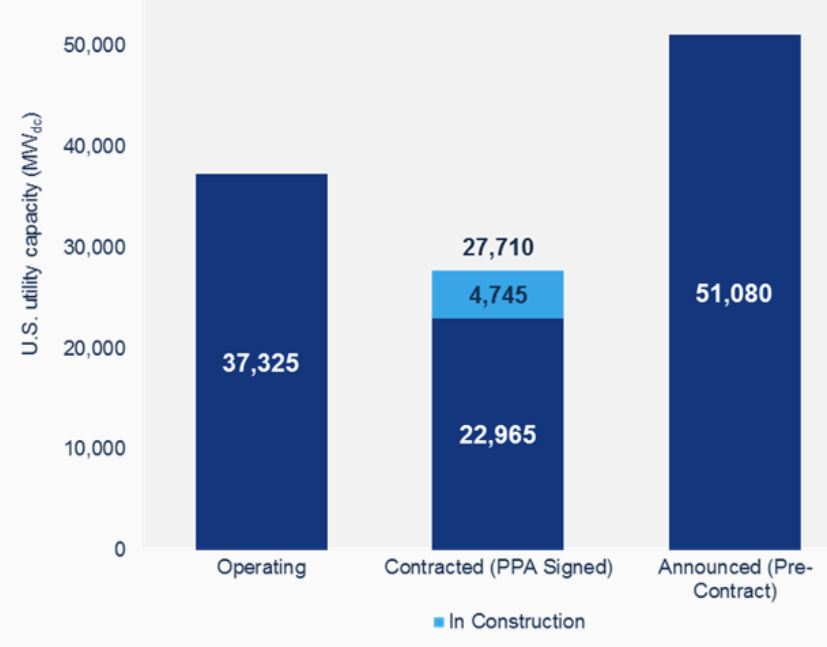
U.S. Utility photovoltaic Pipeline, Q2 2019. Chart courtesy of Wood Mackenzie/SEIA U.S. Solar Market Insight Report
The 2019-2024 forecast has grown by more than 5GW since the last quarter—Florida is the largest contributor to this increase as its five-year outlook rose from 6GW to 9GW due to new solar procurement by Florida Power & Light, Duke Energy Florida, as well as other state utilities. That positions the Sunshine State to lead the utility photovoltaic category over the next six years.
Voluntary procurement of utility photovoltaic based on its economic competitiveness continues to be the primary driver of projects announced this year. Corporate procurement of utility solar drove 22 percent of projects announced last year, with 14 percent of projects announced this year having a corporate customer. However, the number of corporations pledging to use 100 percent renewable power is increasing, thus corporate procurement is poised to remain a strong driver of utility photovoltaic.
Residential PV
The residential sector has registered annual growth, too, as 603 megawatts of residential solar installations started commercial operation during this period, rising 6 percent annually and 8 percent below the last quarter of 2018. However, despite robust installations, the residential market is still highly reliant on legacy states such as California and the Northeast. Even so, 29 percent of residential capacity in the first quarter of the year comes from markets outside the top 10 solar states by capacity, which marks the highest share for emerging markets in the industry’s history.
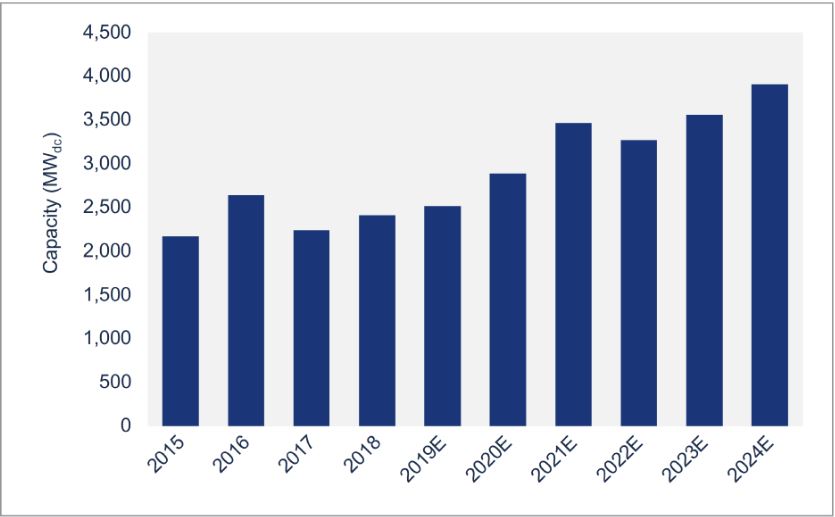
Residential photovoltaic installations and forecast, 2015 – 2024. Chart courtesy of Wood Mackenzie/SEIA U.S. Solar Market Insight Report
The report’s authors that in the long run the ITC step-down will pull in demand in both legacy and emerging markets before declining in 2022, with growth to resume in 2023 and continue well into 2024 as the market adjusts to post-ITC market conditions.
Non-residential PV
Non-residential photovoltaic segment—which includes commercial, industrial and public sector distributed solar—totaled 438 megawatts DC installed. This shows a contraction of 18 percent year-over-year and 28 percent below the rate of last year’s fourth quarter, marking its lowest quarter since 2017. The decline is the result of state-level policy reforms in historically strong markets for the segment including California, Massachusetts and Minnesota. The report points to new community solar mandates in New York, Maryland, Illinois and New Jersey that will help reinvigorate the segment starting in 2020.
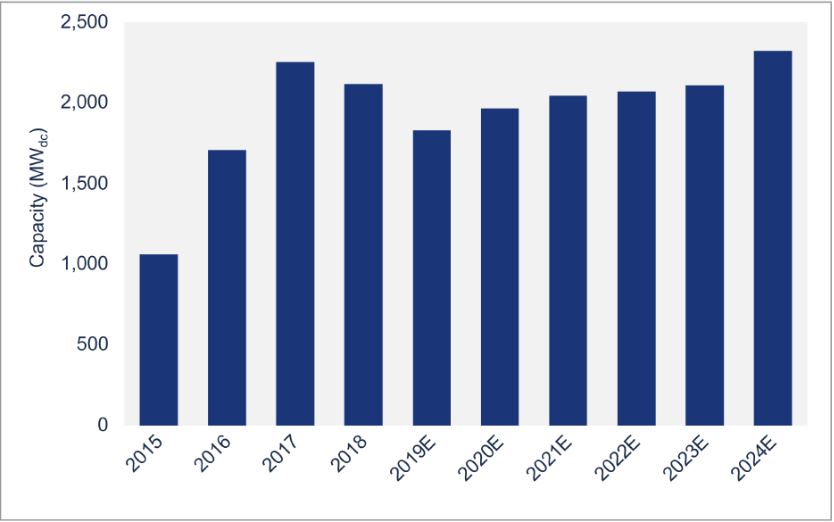
Non-residential photovoltaic installations and forecast, 2015 – 2024. Chart courtesy of Wood Mackenzie/SEIA U.S. Solar Market Insight Report
Solar-plus-storage will also begin to have an impact on non-residential demand as policymakers and business leaders consider energy storage in their decisions. By 2023, roughly 30 percent of total non-residential photovoltaic will come from community solar and about 20 percent will come from solar-plus-storage projects, as per the report.
Pricing
In the first quarter of the year, prices fell in all market segments—by 3 percent, 2.7 percent, 0.1 percent and 0.1 percent in residential, non-residential, utility fixed-tilt and utility single-axis tracking markets, respectively. Despite tariffs on modules, inverters, aluminum and steel, prices across market segments are now all at historic lows $2.89/Wdc, $1.47/Wdc, $0.93/Wdc and $1.04/Wdc for residential, non-residential, utility fixed-tilt and utility single-axis tracking systems, respectively.


You must be logged in to post a comment.