Office Report: Discounted Sales Multiply, Pressures Persist
Hybrid work and rising vacancies continue to shape the sector, according to Yardi Matrix.
With approaching maturities and high vacancies hitting most markets, discounted sales are rising in the office sector, according to the latest Yardi Matrix national office report. More specifically, a whopping 46 percent of assets sold at a discount this year through July, meaning they traded for a lower price that their previous sale. That’s a significant jump from the 20 percent recorded in 2021.

Some of the top markets with high percentages of discounted sales since 2024 include Houston (69 percent), San Francisco (67 percent), Manhattan (64 percent), Washington, D.C. (64 percent) and Dallas (61 percent).
This trend is primarily hitting CBDs, where 70 percent of properties sold at lower prices. Meanwhile, the figure hit 45 percent for urban areas outside CBDs. Suburbs, meanwhile, fared best, with discounted sales accounting for only 39 percent of all deals since 2023.
The total national office transaction volume hit $27 billion this year through July, with assets trading at an average of $182 per square foot. Manhattan, while still the largest office market in the country, landed in the third spot, with $3.1 billion in deals. The new leader, the Bay Area, recorded $3.1 billion in sales, followed by Washington, D.C.’s $2.9 billion. Discounted deals are expected to continue, as loans extensions are declining and underperforming assets are expected to drive prices some more, making space for a variety of investors and conversions.
READ ALSO: Worth the Risk: Value Investors Chase Office Deals
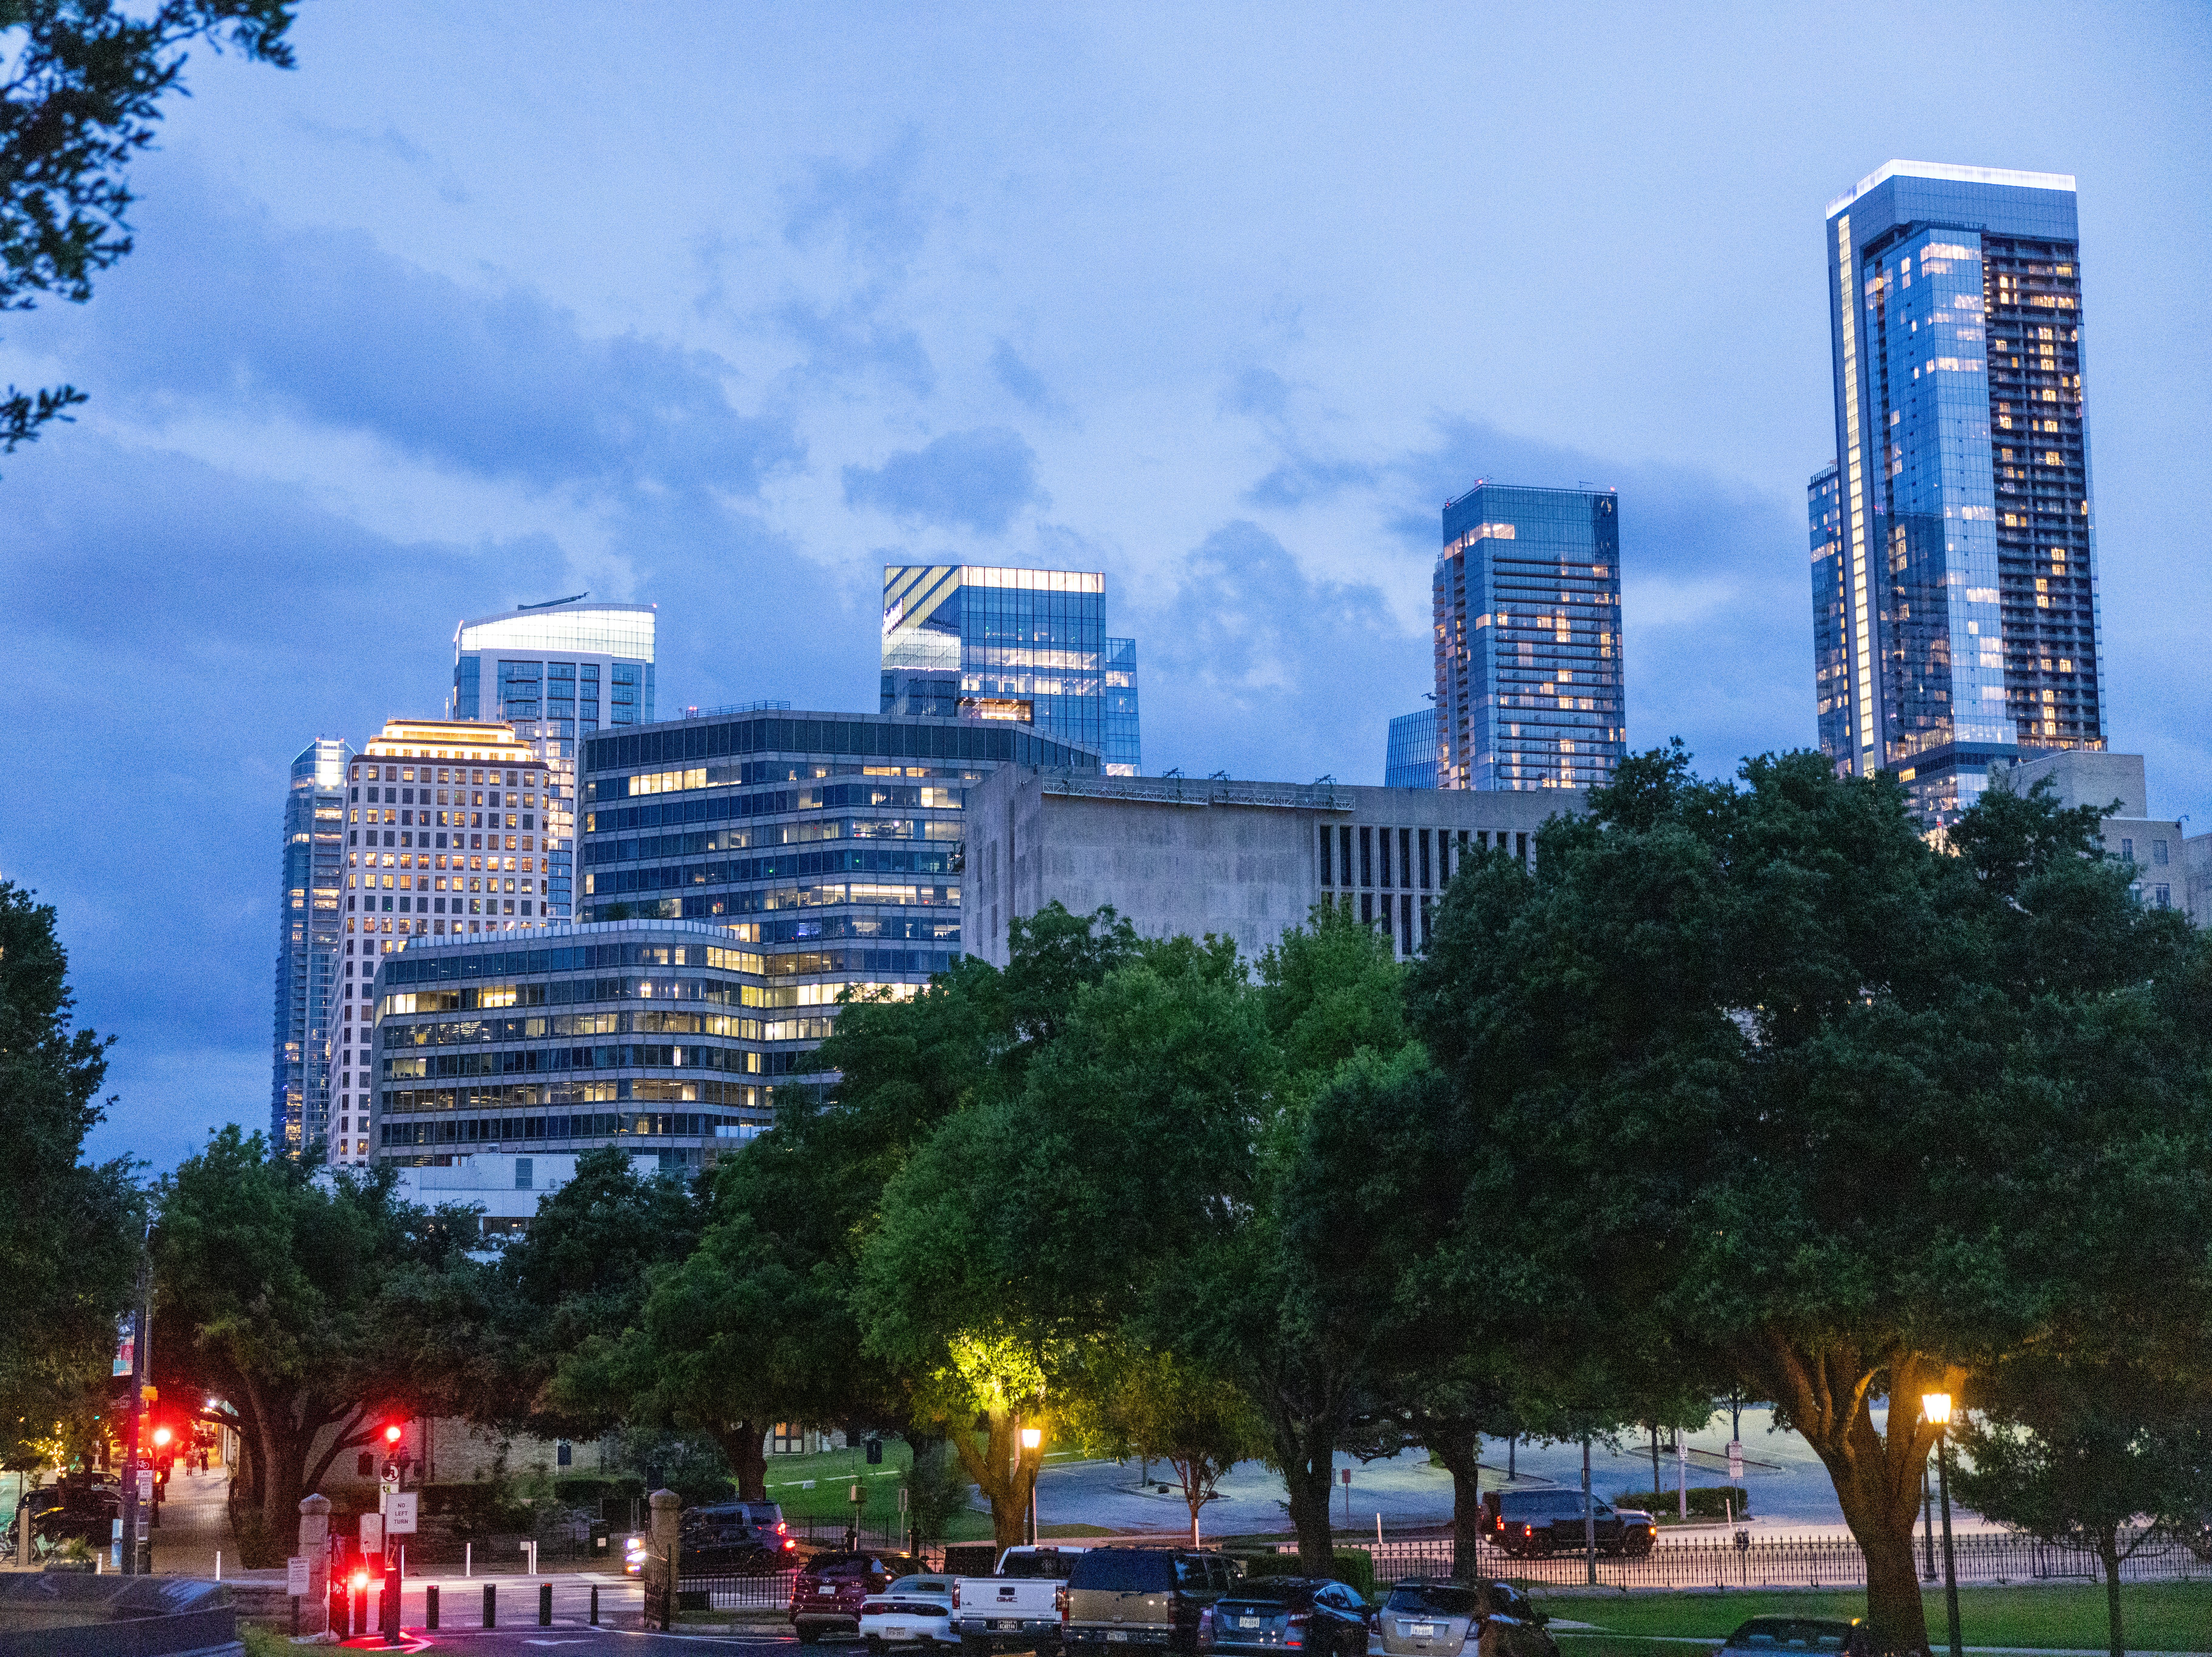
The national office vacancy rate stood at 19.4 percent as of July—unchanged from the previous two months and marking a 130-basis-point year-over-year increase. The market with both the highest vacancy and a significant year-over-year jump remains Austin, where the rate clocked in at 27.2 percent after a 430-basis-point yearly jump. While the metro registered strong office utilization and employment growth in recent years, the impact of the 14.3 million square feet of stock coming online since the start of the decade is likely to push Austin’s vacancy further.
Other markets with high vacancies include Seattle (27.0 percent), San Francisco (26.3 percent) and Detroit (24.6 percent). At the other end of the spectrum stood Miami (14.3 percent), scoring the lowest vacancy.
Nationally, office-using employment lost 1,000 net jobs in July, led by the professional and business services sector (-14,000 positions). Meanwhile, financial activities offset that by gaining 15,000 jobs. Year-over-year, the overall national increase in office-using employment sat at a mere 0.1 percent, representing 41,000 jobs added.
Rents keep course, development still muted
National in-place rents stood at $32.72 per square foot as of July—15 cents lower than the previous month but seeing a 3.3 percent year-over-year increase. Markets with the highest jumps in rents included Charlotte, Miami and Orlando. At the other end, Houston rents saw a 7.6 percent year-over-year drop.
The national under-construction pipeline comprised 40.2 million square feet as of July, representing 0.6 percent of stock—unchanged from the previous month. The leader in construction activity remains Boston, with 5.6 million square feet underway.
Meanwhile, Manhattan’s pipeline included 2.6 million square feet underway as of July. Owner-occupied projects aside, the borough registered less than 500,000 square feet in construction starts since the start of 2023. Of course, this excludes several high-profile developments, such as JP Morgan’s 2.5 million-square-foot 270 Park tower, which is close to completion.
Read the full Yardi Matrix office report.


You must be logged in to post a comment.