

National Vacancies
Forecasts show that, in the second quarter of 2018, net absorptions are expected to decrease in every region, with the most significant change expected to come from the Northeast, followed by the South with 13.8 percent.
U.S. industrial market conditions from Q2 2015 to Q2 2018*
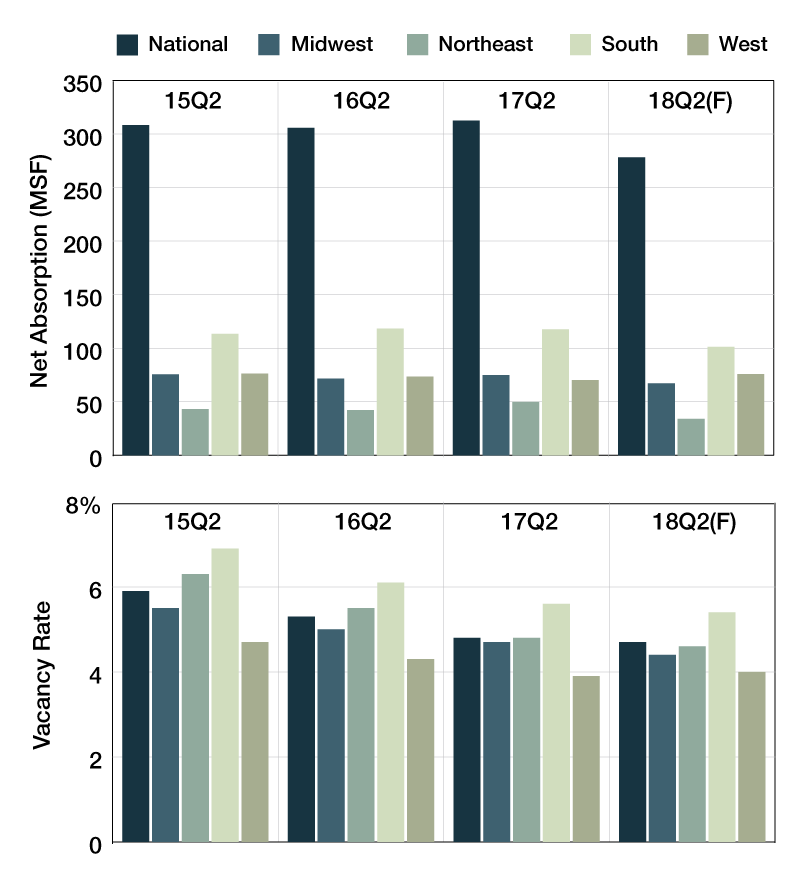
*Monthly chart cycles among office, industrial and retail. Source: CoStar Group Inc.
Net absorptions increased for industrial markets in most regions in the second quarter of 2017, compared to the same interval in 2016. The largest gains were posted by the Northeast (18.2 percent), followed by the Midwest (4.6 percent). Industrial net absorptions on a national level increased by only 2.3 percent. Vacancy rates dropped for industrial markets on a year-over-year basis, with the most significant change recorded in the Northeast—down from 5.5 percent to 4.8 percent in the second quarter of 2017.
Forecasts show that, in the second quarter of 2018, net absorptions are expected to decrease in every region, with the most significant change expected to come from the Northeast, followed by the South with 13.8 percent. Vacancy rates for industrial markets are expected to decrease by 0.6 percent on a national level, while rates are projected to decrease by 0.9 in the Northeast and by 0.7 in the South. No increases are expected in the remaining regions.


You must be logged in to post a comment.