2018 Transaction Volume
U.S. volume based on properties and portfolio sales of $2.5 million and greater, updated quarterly.
Source: Real Capital Analytics Inc., www.rcanalytics.com
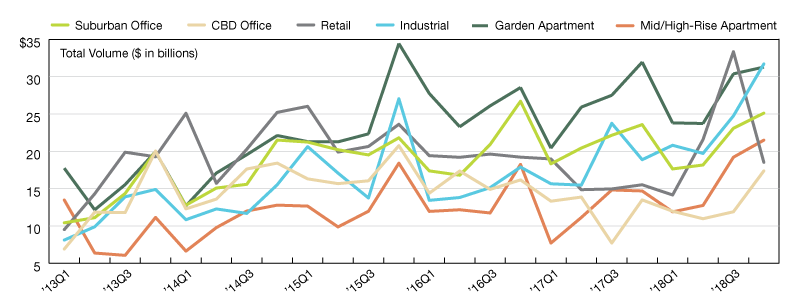
Transaction volume for all major property types reached $576.1 billion in 2018, increasing by 18 percent year-over-year, according to Real Capital Analytics. Industrial assets led in sales volume, with total transactions amounting to $97 billion in 2018, for a 32 percent change year-over-year. The retail sector led growth in percentage change year-over-year (up by 36 percent), reaching $87.6 billion in total investment volume. Office CBD sales were up by 8 percent ($51.2 billion), while Office Suburban sales dropped by 1 percent ($84 billion). Mid- and High-Rise Apartment sales were up by 35 percent ($65.3 billion), while Garden Apartment investment volume reached $109.2 billion, for a 3 percent expansion year-over-year.
—Posted on Apr. 23, 2019
Source: Real Capital Analytics Inc., www.rcanalytics.com
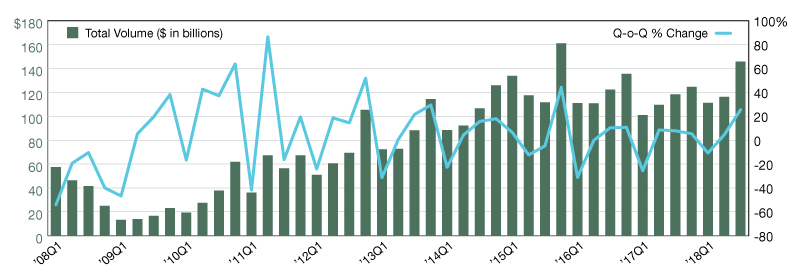
Transaction volume for all major property types reached $145.8 billion in the third quarter of 2018, up by 23.3 percent year-over-year ($27.6 billion). Compared to the same interval in 2016, transaction volume went up by 19.2 percent ($23.5 billion). Investment activity peaked in the third quarter of 2018 ($145.8 billion) during the past 12 months.
Quarter-over-quarter, transaction volume for all property types increased by 25.5 percent. Mall, other and strip properties recorded a 33 percent surge, while transaction volume for suburban office assets went up by 27 percent. Office CBD properties posted a 10 percent increase, while flex & warehouse assets posted a 25 percent growth in sales volume. Investment activity increased for Garden apartments as well, recording a 26 percent rise, while sales volume for Mid- and High-rise apartments increased by 54 percent quarter-over-quarter.
—Posted on Jan. 11, 2019
Source: Real Capital Analytics Inc., www.rcanalytics.com
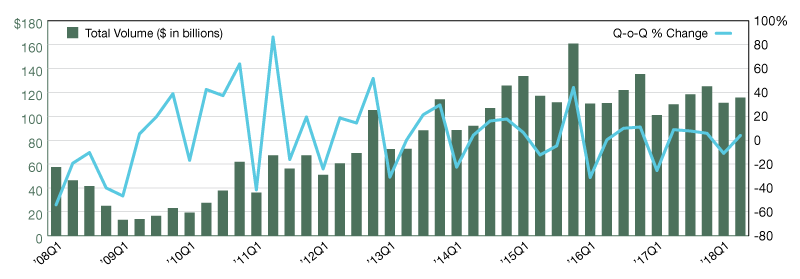
Transaction volume for all major property types reached $115.7 billion in the second quarter of 2018—that’s a 5.3 percent increase year-over-year ($109.9 billion), and a 4.3 percent increase compared to the same interval in 2016 ($4.8 billion). Investment activity peaked in the fourth quarter of 2017 ($125.1 billion) in the past 12 months.
Quarter-over-quarter, transaction volume for all property types increased by 4.0 percent. Mall, other and strip properties recorded a surge of nearly 50.0 percent, while transaction volume for suburban assets went up by 5.0 percent. Office CBD properties posted a 6.0 percent decrease, followed by flex & warehouse assets with an 8.0 percent drop in sales volume. Investment activity lagged for Garden apartments as well, recording a 3.0 percent decrease, while sales volume for Mid- and High-rise apartments increased by 5.0 percent quarter-over-quarter.
—Posted on Oct. 11, 2018
Source: Real Capital Analytics Inc., www.rcanalytics.com
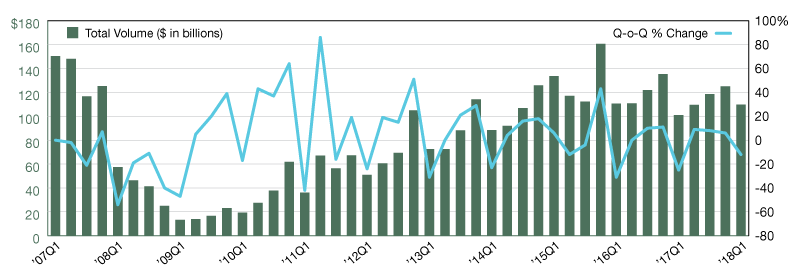
Transaction volume for all major property types reached $109.7 billion in the first quarter of 2018, up by 8.8 percent year-over-year ($100.9 billion) and down by almost $870 billion compared to the same interval in 2016. Investment activity peaked in the fourth quarter of 2017 ($125.1 billion) in the past 12 months.
Quarter-over-quarter, transaction volume for all property types decreased by 12.2 percent. Office CBD properties recorded an 18.5 percent decrease, followed by suburban office assets with a 27.2 percent drop in sales volume. Investment activity lagged for Garden apartments as well, recording a 25.3 percent decrease, and Mid- and High-rise apartments (down by 19.8 percent). Transaction volume for Flex & Warehouse assets increased by 11.9 percent in the first quarter of 2018, compared to the previous quarter.
—Posted on July 11, 2018

You must be logged in to post a comment.