Industrial Report: Tariff, Construction Uncertainty Reshape Market Dynamics
Despite trade tensions and rising costs, rents and investment stay strong, according to Yardi Matrix research.
The U.S. industrial market is navigating a complex landscape shaped by shifting trade policy, rising material costs and a cooling construction pipeline, the latest Yardi Matrix national industrial report shows.
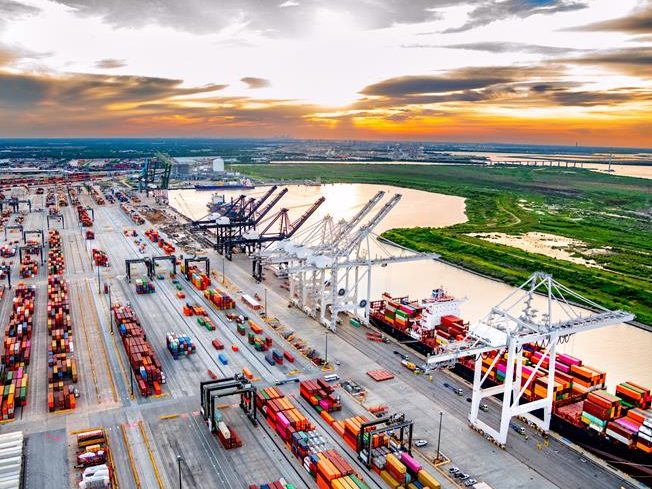
The current trade policy has led to the imposition of a 135 percent tariff on Chinese imports as of April triggering a sharp pullback in port activity. As a result, the Port of Los Angeles saw 25 percent less cargo than expected in May. Import volumes fell nearly 20 percent month-over-month as of April, though they remained up 2.2 percent year-over-year, according to the data provider.
In response, logistics operators are turning to bonded warehouses—facilities that allow goods to be stored without immediate tax payment—as a hedge against future tariffs. While costly and complex to implement, these facilities offer increased flexibility in managing inventory and cost. With a 90-day reprieve in place, another surge in imports is expected this summer as firms prepare for the holiday season.
Development pipeline shrinks amid cost pressures
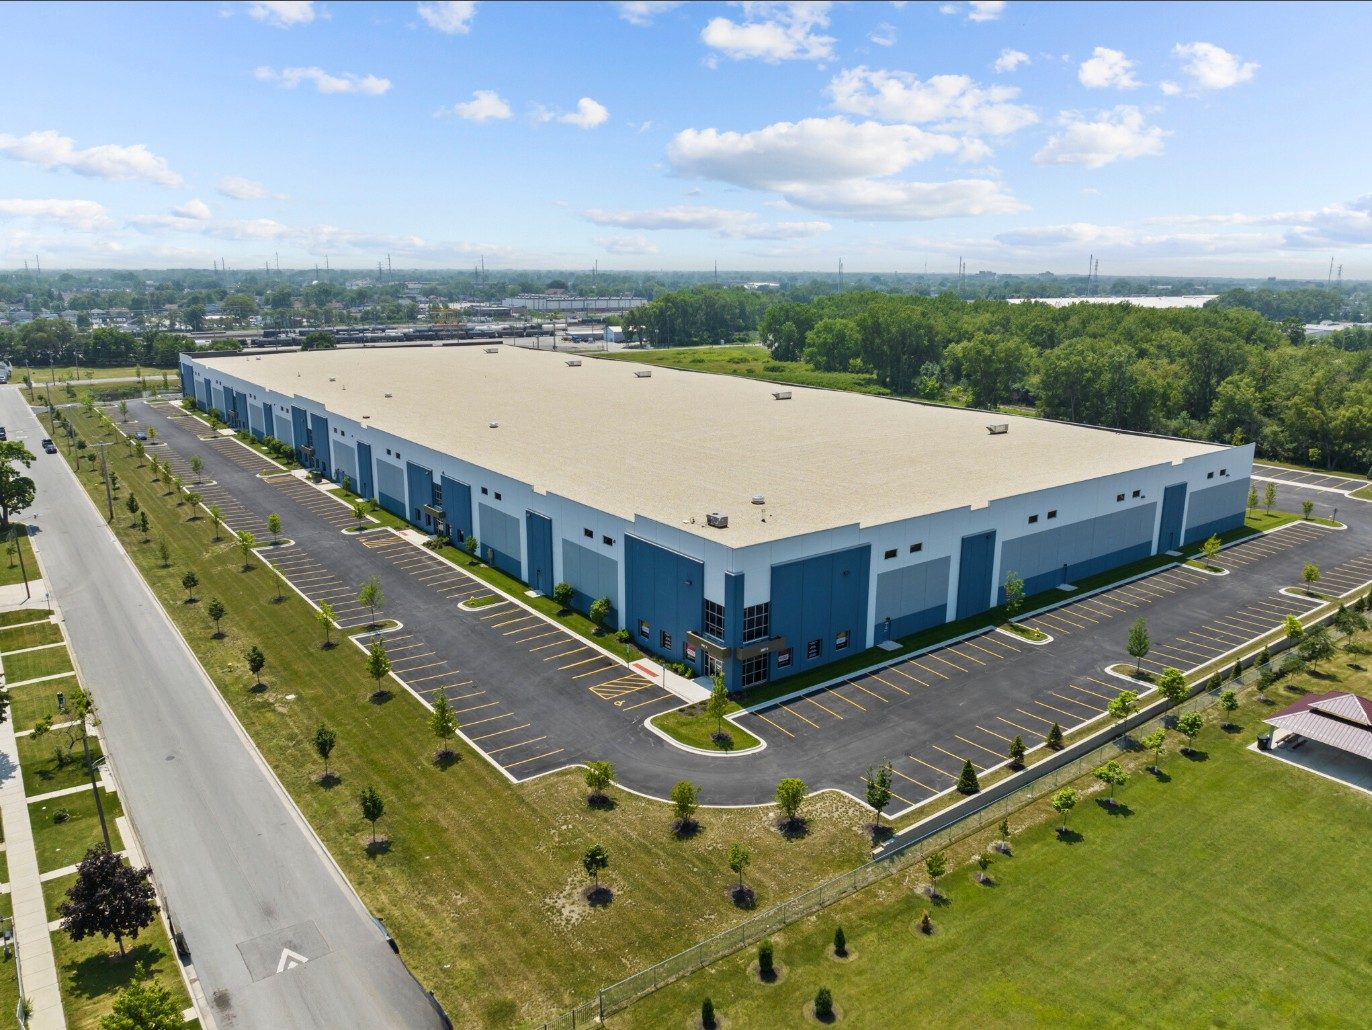
As of May, 342.3 million square feet of industrial space was under construction in the U.S., accounting for 1.7 percent of total inventory. Only 86.9 million square feet of new starts were recorded through the first five months of the year—putting 2025 on pace for the lowest annual total since 2018. Developers are facing headwinds from elevated interest rates and a 50 percent tariff on imported steel, which has significantly increased project costs.
Despite the slowdown, some markets remain active. Memphis leads the nation with 4.2 percent of its inventory under construction, followed by Phoenix (3.9 percent) and Dallas (2.8 percent). These metros continue to attract tenants and capital, even as national development momentum fades.
READ ALSO: E-Commerce Continues to Steer Logistics Demand
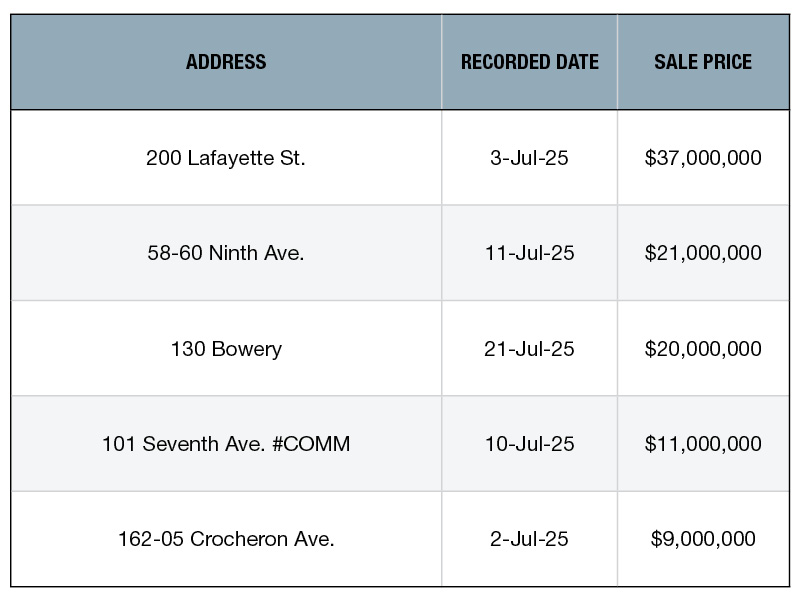
Industrial sales totaled $21.4 billion through May, with properties trading at an average of $133 per square foot. Phoenix stood out with $862 million in sales—the sixth-highest nationally—despite being only the 10th-largest market by inventory. The metro’s average price per square foot rose to $187, up 14.2 percent year-over-year and 24.4 percent over 2023. Los Angeles led all markets in pricing at $311 per square foot, followed by Orange County ($282), New Jersey ($276) and the Inland Empire ($249).
Vacancy remains steady as rents continue to climb
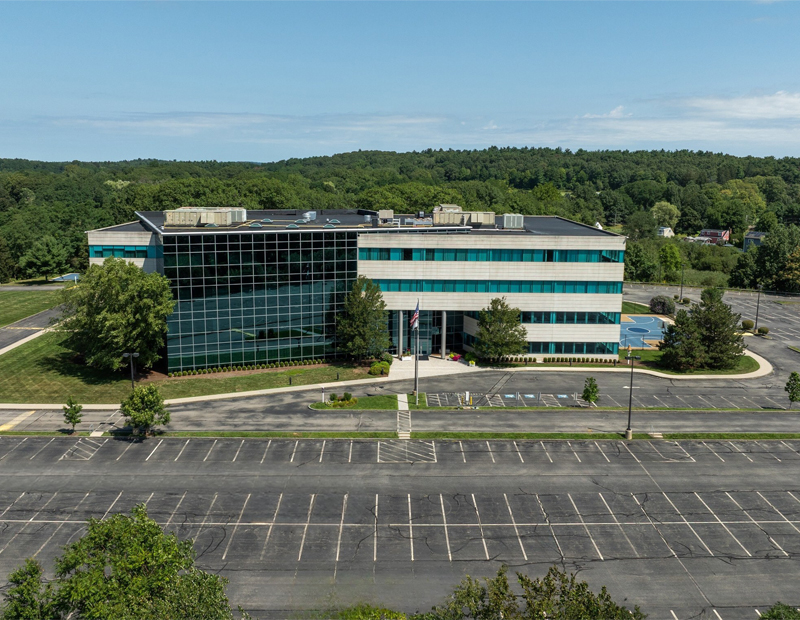
National in-place rents averaged $8.54 per square foot as of May, up 6.3 percent year-over-year. Miami led all markets with 9.8 percent rent growth, followed by New Jersey (9.2 percent) and Atlanta (9.1 percent). Orange County posted the highest average rent at $16.69 per square foot, while Los Angeles and the Bay Area followed at $15.23 and $13.79, respectively.
The national vacancy rate dipped slightly to 8.5 percent, down 30 basis points from April but still up 290 basis points year-over-year. The spread between new leases and in-place rents narrowed to $1.79 per square foot, down from $2.25 a year earlier—a sign that tenants are gaining leverage in lease negotiations.
Read the full report.


You must be logged in to post a comment.