

Industrial Rents, Investment Soar
Tenants have been paying a premium for new leases in nearly all major markets during the past 12 months, while investors’ appetite for sale-leaseback transactions has been increasing.
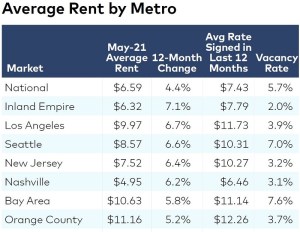
CommercialEdge data as of May 2021.
The U.S. industrial market is continuing to perform, CommercialEdge’s June industrial report shows. Rents averaged $6.59 per square foot in May, marking a 4.4 percent increase over the year. Tenants have been paying a premium during the past year for new leases in nearly all major markets: Those leases had a rate an average of $0.84 higher than the average rent—a 12.7 percent premium.
Despite strong increases at the national level, rent growth was uneven at the regional level. Many coastal markets saw swift increases—the Inland Empire and Los Angeles top the list with 7.1 percent and 6.7 percent growth. At the other end, non-coastal markets, particularly those in the Midwest, fared less well. St. Louis rents decreased by 1.8 percent year-over-year, despite vacancies well below the national rate.
The national vacancy rate was 5.7 percent in May although, as with rent growth, there was significant variation across regions. Southern California had some of the tightest vacancies, with three markets—the Inland Empire, Orange County and Los Angeles—among the five markets with the lowest figures nationwide.
Industrial development remains strong, with just shy of 99 million square feet of new inventory delivered nationwide in the first five months of 2021. An additional 410 million square feet was under construction at the end of May, accounting for 2.9 percent of stock. The market with the largest amount of development relative to existing stock was Phoenix, with 17.2 million square feet underway (6.5 percent of stock). Tennessean markets also had significant activity thanks to land availability and demand for more economically priced space: Memphis developments totaled 13.4 million square, or 5.6 percent of stock, with Nashville right behind with 8.1 million square feet underway accounting for 4.7 percent of inventory.
More than $18.1 billion in industrial transactions closed through May, with the year’s volume expected to either meet or surpass last year’s $44.4 billion volume. Sale prices have shot up more than 16 percent compared to last year, averaging $103 per square foot. Pricing was highest in Orange County ($271 per square foot) and New Jersey ($233 per square foot) as investors vie for high-demand space in port markets.
Nationally, the appetite for sale-leaseback transactions appears to be growing, accounting for 9 percent of deal volume compared to 7 percent last year. This deal structure, which has provided liquidity for industrial users that were hit hard by the pandemic, has enabled many investors to move into the sector without the need to lease up an asset.
Read the full CommercialEdge report.

You must be logged in to post a comment.