


Falling Office Vacancy Contrasts With Rising Distress
Large properties continue to face pricing challenges as investors favor amenity-rich assets, Yardi Matrix data shows.
Discounted sales are still rising in the sector for properties unable to adapt to shifting demand, according to the latest Yardi Matrix national office report.
Though vacancy is on the decline, office utilization did not significantly increase, while hybrid work is being widely adopted. Kastle’s Back to Work Barometer indicates that office attendance has remained at around 55 percent for the last few years. Office fundamentals remain challenged, making a sustained decline in vacancy unlikely. Market bifurcation across property types will continue and is expected to grow as AI adoption increases.
Distress continues to rise across the sector. Since 2024, distressed properties have accounted for 19.4 percent of the 800 million square feet that changed ownership—up 6.2 percent from the deals closed between 2021 and 2023. Urban core assets are experiencing the highest rate of distress. Since 2024, distressed transactions accounted for 34.6 percent of the square footage sold in CBDs, compared to 23.5 percent for urban area properties and 12.1 percent for suburban spaces. The average size of an asset involved in a distressed transaction doubled to 200,000 square feet from the 100,000 square feet before the pandemic. This highlights the challenges larger properties face in adapting to substantial changes across the sector.
CBD office assets continue to face pricing pressures as flight-to-quality trends concentrate demand into fewer places. Since 2024, 73 percent of properties in CBDs with at least two sale prices for comparison have traded at a discount, in contrast with 48 percent of urban transactions and 42 percent of suburban deals. Seattle is the metro that illustrates this trend, as hybrid work persists and tech layoffs continue to weigh on its urban core. A 44-story tower in the city’s CBD is currently under contract to be sold for $280 million—54 percent lower than its 2019 sale price. If the transaction closes, Spear Street Capital will be the new owner of the U.S. Bank Center, buying it from Perform Properties, a Blackstone subsidiary.
READ ALSO: Navigating the Distressed Asset Life Cycle
A historically low construction pipeline should ease pressure in the sector. Uncertainties about rising inflation and AI adoption will require greater flexibility from owners. Properties that can adapt to these changes will likely benefit, while coworking and flight-to-quality trends will continue to reshape demand.
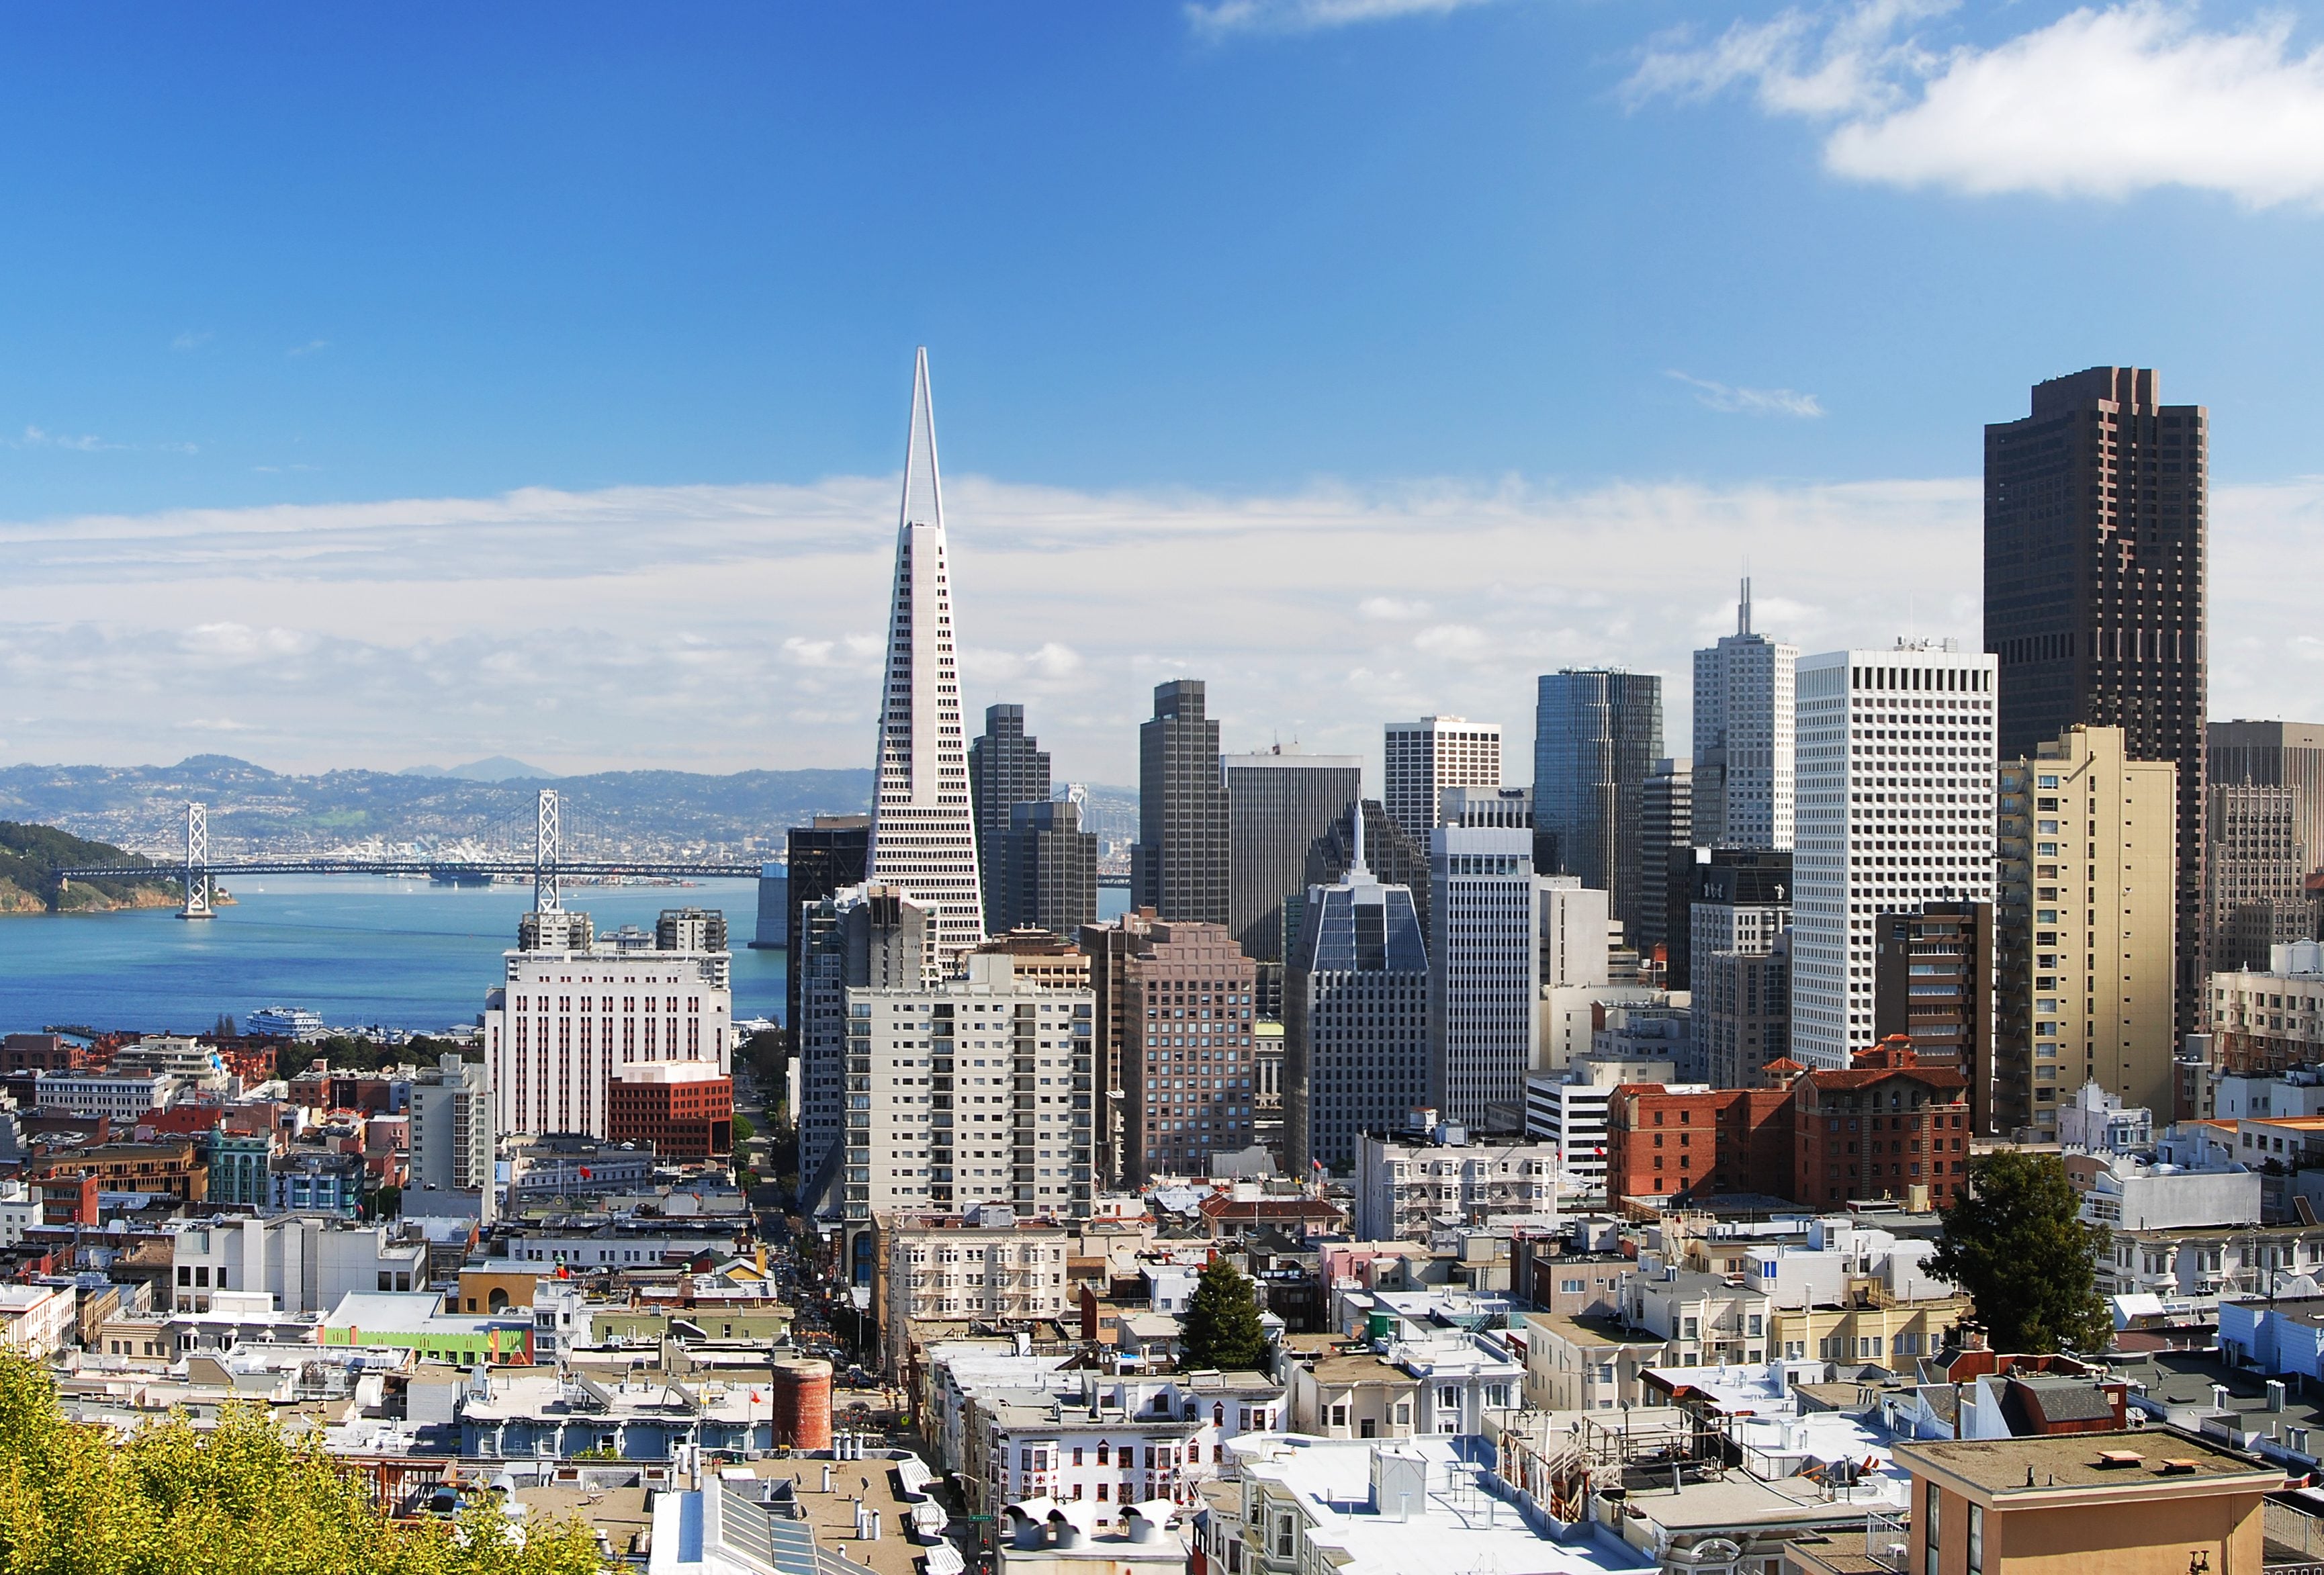
The national office vacancy rate stood at 17.6 percent as of May—180 basis points lower over the past 12 months. San Francisco recorded the highest decrease nationwide at a 520-basis-point drop to a 23.3 percent rate. The metro’s rate declined after the peak of 29.3 percent recorded in January 2025. After several years of losses, office employment growth started to stabilize in San Francisco. The metro was hit hard due to the tech layoffs started in 2022, as the city has a high concentration of companies in the sector. However, the tech hubs began to benefit from AI adoption, more than in other metros, particularly in the information sector, while finance and professional business services also captured gains. This helped slowing San Francisco’s office employment losses and also improved its vacancy.
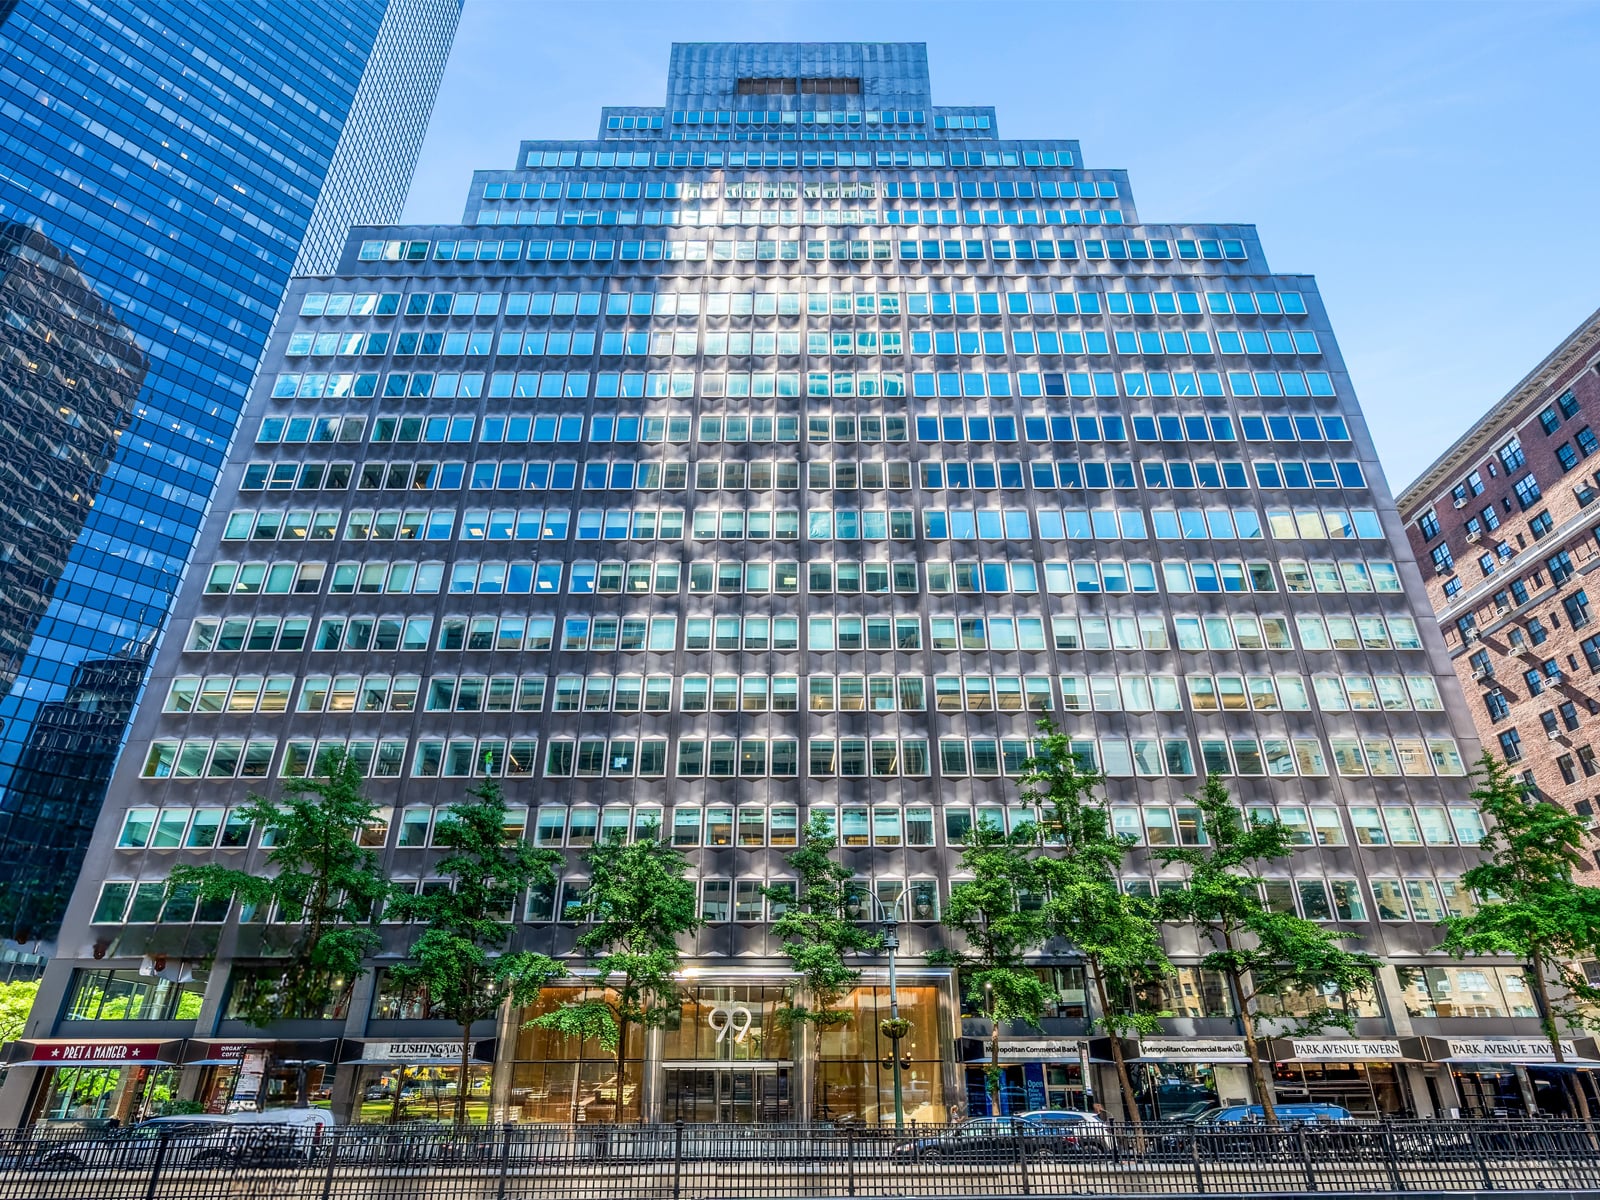
Manhattan stood out as the market with the lowest rate nationwide, at 13.1 percent, followed by Miami’s 13.2 percent. In contrast, Austin recorded the highest rate in the country at 24 percent, representing a 440-basis-point year-over-year decline.
National in-place rents stood at $33.61 per square foot in May—up 70 cents from the previous month and 1.4 percent lower from a year ago. Manhattan led the charts for office rents, with listing rates at $69.29 per square foot, followed by San Francisco’s $62.11 per square foot.
National pipeline shrinks, weaker assets struggle
The national under-construction pipeline comprised 28.7 million square feet, accounting for 0.4 percent of existing stock. Year-to-date through May, office deliveries totaled 9.9 million square feet.
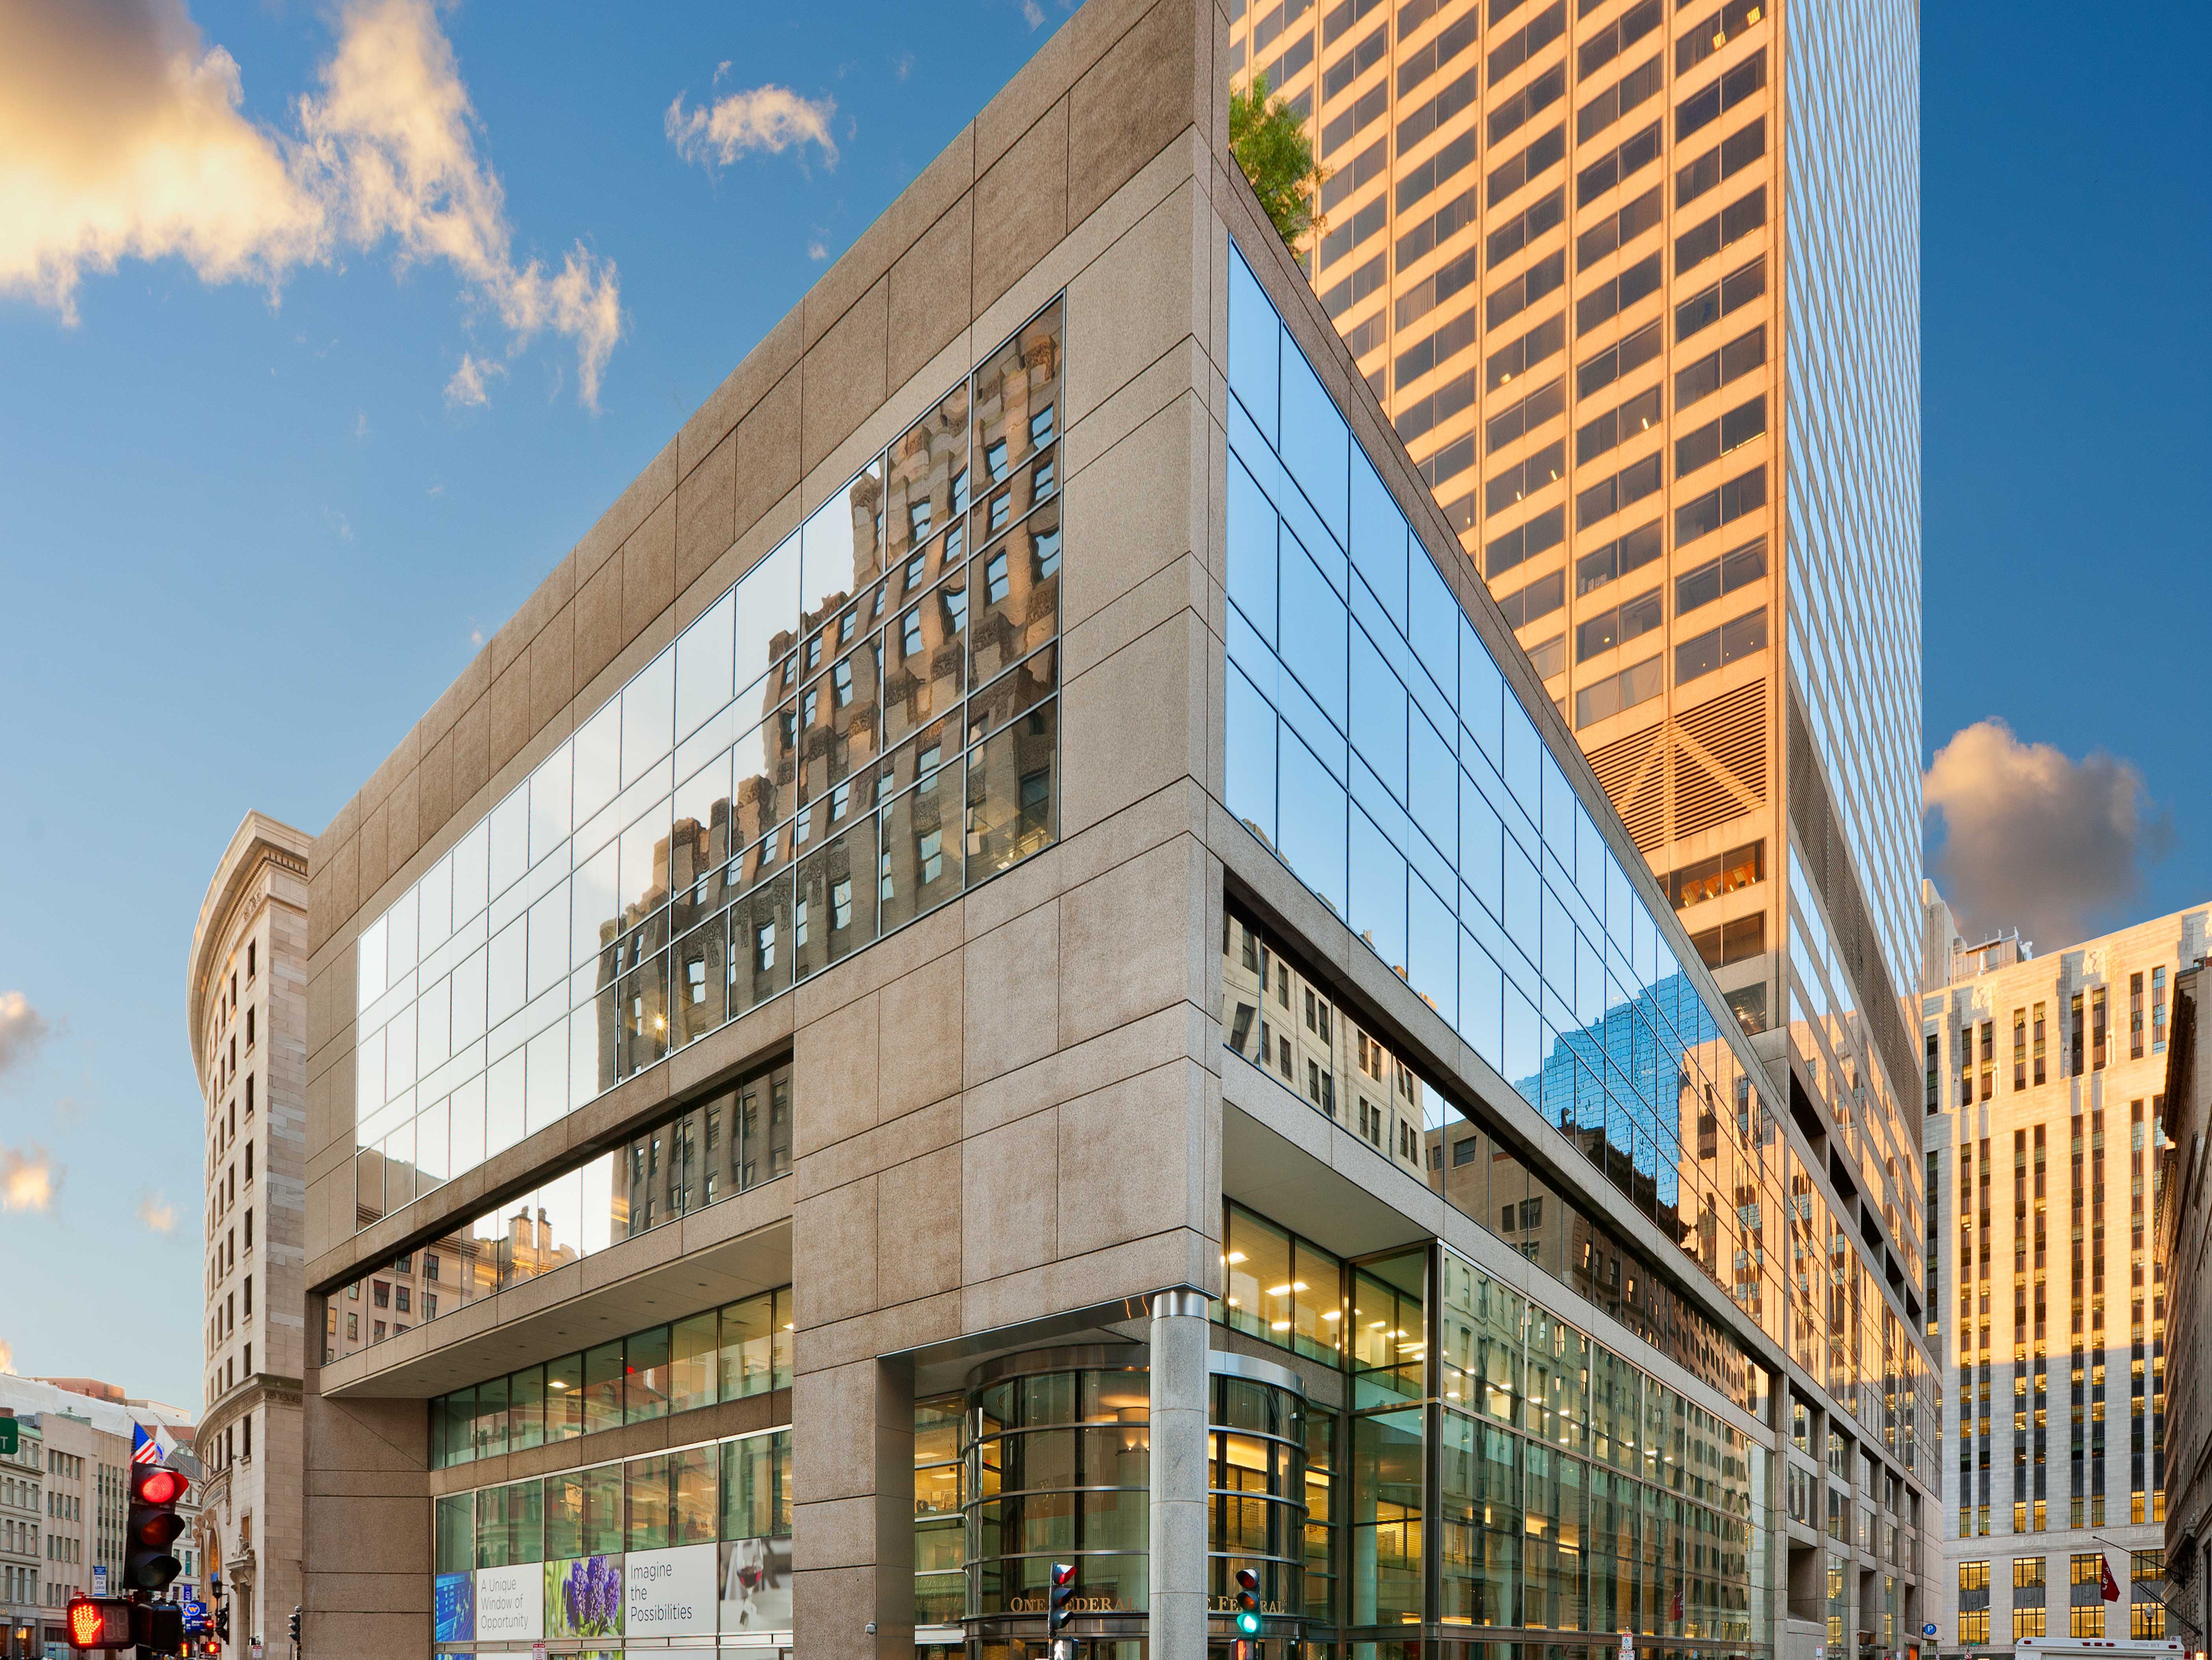
Boston led again in office development, with 3.9 million square feet underway as of May. Manhattan followed with 3.1 million square feet. Austin continues to be among the metros with the largest pipeline, with 1.2 million square feet underway. The metro’s activity dropped by more than half over the past 12 months, as construction starts included 600,000 square feet.
The metro continues to face challenges despite its strong office employment growth and ongoing corporate relocations. Austin’s shrinking pipeline should help rebalance fundamentals over time, but its wave of new supply is likely to impact the metro some more for the foreseeable future.
The U.S. office sector saw 1,025 transactions close, with assets selling at a $213 per square foot average and generating $23 billion as of May. The leader for office investment remains Manhattan, with $3.7 billion in deals. San Francisco ($2.3 billion) and the Bay Area ($1.7 billion) followed.
On the opposite end of the list is Portland, where office sales totaled $106 million. Since 2024, 53 percent of transactions in the metro have closed at a discount compared to their previous sale price. Portland assets sold at $91 per square foot on average in 2025—73 percent down from the 2020 peak. So far in 2026, the average sale price in the metro stands at $119 per square foot, still at a significant decline. In April 2026, Central City Concern paid $11 million for a 108,000-square-foot building—a 77 percent discount from the property’s sale price from 2015.
Read the full Yardi Matrix office report.


You must be logged in to post a comment.