

Economy Watch: Employment Continues to Strengthen State-by-State
Many states came close to full employment in 2017, with seven states recording their lowest unemployment rates in more than 40 years, according to the latest U.S. Bureau of Labor Statistics report.
By D.C. Stribling, Contributing Editor
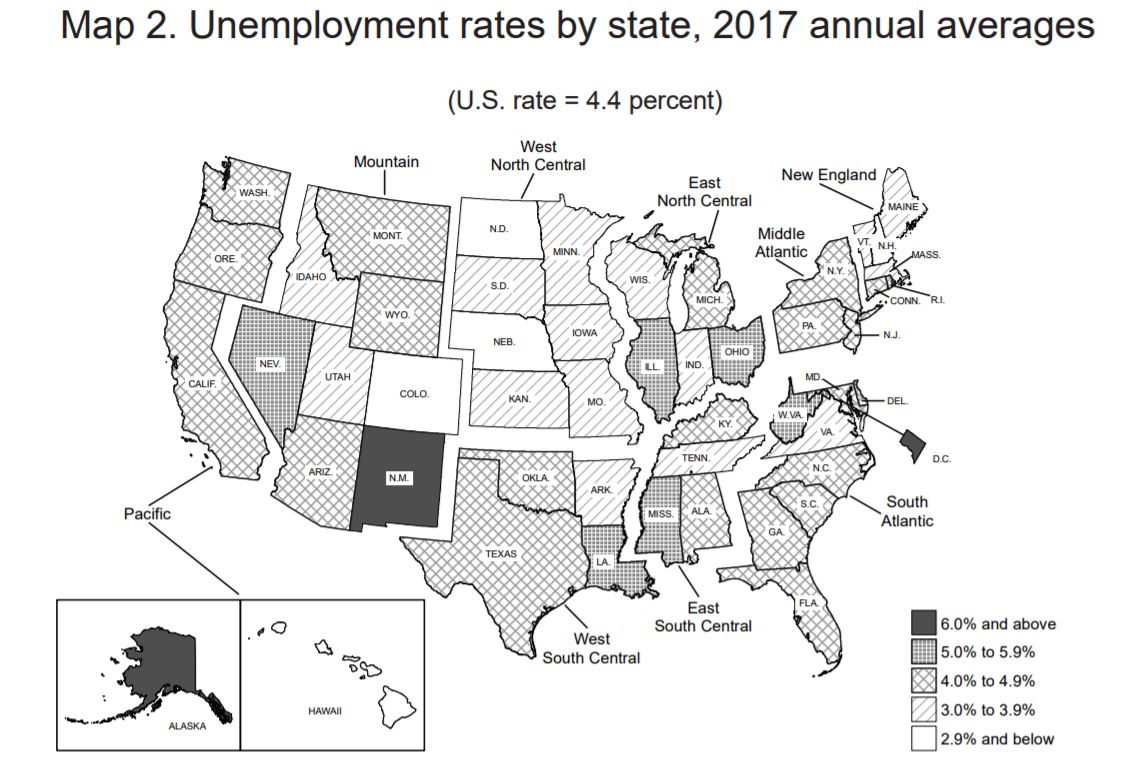
Source: U.S. Bureau of Labor Statistics, Regional and State Unemployment, 2017 Annual Averages
In 2017, annual average unemployment rates decreased in 32 states and were unchanged in 18 states and the District of Columbia, the Bureau of Labor Statistics reported this week. Employment-population ratios increased in 12 states, decreased in two states, and were unchanged in 36 states and D.C. The U.S. jobless rate declined by 0.5 percentage points from the end of 2016 to 4.4 percent at the end of 2017, and the national employment-population ratio rose by 0.4 percentage points to 60.1 percent.
Thirty-two states enjoyed unemployment rate decreases in 2017, according to the bureau. The largest drop happened in Alabama (down 1.5 percentage points), followed by Wyoming (down 1.1 points) and Tennessee (down 1 point). The other 18 states and D.C. had annual average jobless rates in 2017 that were not appreciably different from those of the previous year.
State Specifics
Hawaii and North Dakota had the lowest unemployment rates among the states in 2017, 2.4 percent and 2.6 percent, respectively, according to the BLS. Alaska had the highest jobless rate, coming in at 7.2 percent, followed by New Mexico at 6.2 percent and D.C. at 6.1 percent.
Perhaps even more remarkably in terms of how close some states are to full employment, in 2017 seven states recorded the lowest unemployment rates in their series, which the BLS began in 1976. In other words, they enjoyed their lowest unemployment rates in more than 40 years. These states were Arkansas (3.7 percent), California (4.8 percent), Hawaii (2.4 percent), Maine (3.3 percent), North Dakota (2.6 percent), Oregon (4.1 percent) and Tennessee (3.7 percent).
North Dakota had the highest proportion of employed persons, the bureau said, 69.6 percent in 2017. The next highest ratios were in Minnesota, at 67.8 percent, and Utah, at 67.2 percent. West Virginia had the lowest employment-population ratio among the states, coming in at 50.5 percent. Overall, 24 states and D.C. enjoyed employment-population ratios significantly higher than the U.S. ratio of 60.1 percent, while 16 states had ratios that were below it.


You must be logged in to post a comment.