

East Coast Ports Challenge West Coast Mainstays
A shift in shipping industry dynamics is underway as the supply chain normalizes, a new CommercialEdge industrial report shows.
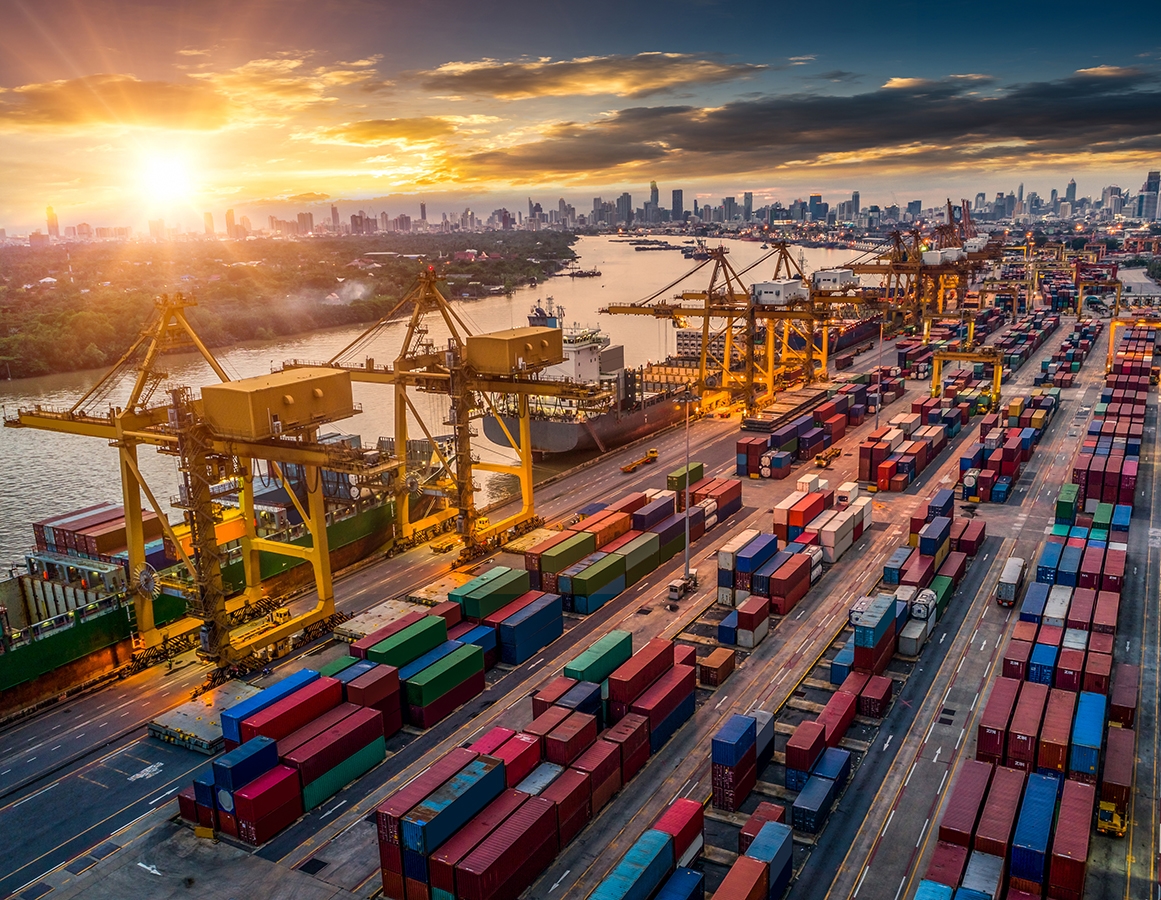
Image by thitivong/iStockphoto.com
The supply chain has normalized after experiencing bottlenecks and backlogs, indicating a new normal for major U.S. ports, according to the latest CommercialEdge national industrial market report. Eastern seaports have gained prominence, expanding their capacities and aiming to capture shipping activity from Southern California ports. The completion of the Panama Canal Expansion in 2016 fueled the growth of East Coast and Gulf of Mexico ports, while Western ports faced challenges such as backlogs, limited industrial space and labor issues that concerned shipping companies.
Despite a tentative agreement on labor issues, the full resolution is pending for the contract covering over 22,000 workers at West Coast ports. Nevertheless, the impact on Western industrial markets has been minimal, with low vacancy rates and strong rent growth, demonstrating the resilience of the local markets. Eastern ports, supported by capital improvements, have successfully positioned themselves as formidable competitors in the shipping industry, challenging the dominance of their Western counterparts.
READ ALSO: Expanding Into Industrial: Diversifying for Long-Term Success
National in-place rents for industrial space averaged $7.18 per square foot at the end of April. Average rents increased by 730 basis points year-over-year and three cents month-over-month. Large coastal markets continued to lead the country in terms of rent growth, with the Inland Empire (18.2 percent increase), Los Angeles (12.3 percent), New Jersey (9.7 percent) and Boston (9.2 percent) recording the highest increases.
Meanwhile, the national industrial vacancy rate was 4.1 percent at the end of April, a 20-basis-point increase from the previous month. The lowest vacancy rates in the country were found in Columbus (1.7 percent), the Inland Empire (1.9 percent), Los Angeles (2.0 percent) and Charlotte (2.4 percent). At the other side of the spectrum, industrial vacancy was highest in Houston (8.4 percent), Boston (6.9 percent), Denver (6.7 percent), Tampa (5.9 percent) and Twin Cities (5.7 percent).
Construction starts show slowdown
As of April, the country’s under-construction pipeline continued to thaw and featured 616.4 million square feet of industrial space, representing 3.4 percent of existing inventory. The largest pipelines on a percentage of stock basis were found in Phoenix (16.3 percent, 57.1 million square feet), Dallas-Fort Worth (6.4 percent, 56.4 million square feet) and the Inland Empire (5.2 percent, 32.6 million square feet).
Another 162.4 million square feet was delivered in the first four months of the year. Dallas–Fort Worth leads in industrial deliveries year-to-date in April, with 17.6 million square feet of new space. It surpassed Indianapolis, the second-highest market, which featured a total of 8.3 million square feet of industrial deliveries.
Industrial sales volume year-to-date in April totaled $12.6 billion, with assets trading at an average of $134.10 per square foot, CommercialEdge data shows. Industrial investment was concentrated in the Inland Empire ($1.7 billion), the Bay Area ($802 million) and Los Angeles ($783 million).
Read the full CommercialEdge report.

You must be logged in to post a comment.