2018 Development
Year-over-year change in U.S. commercial real estate under construction in the industrial, office and retail sectors, updated monthly.
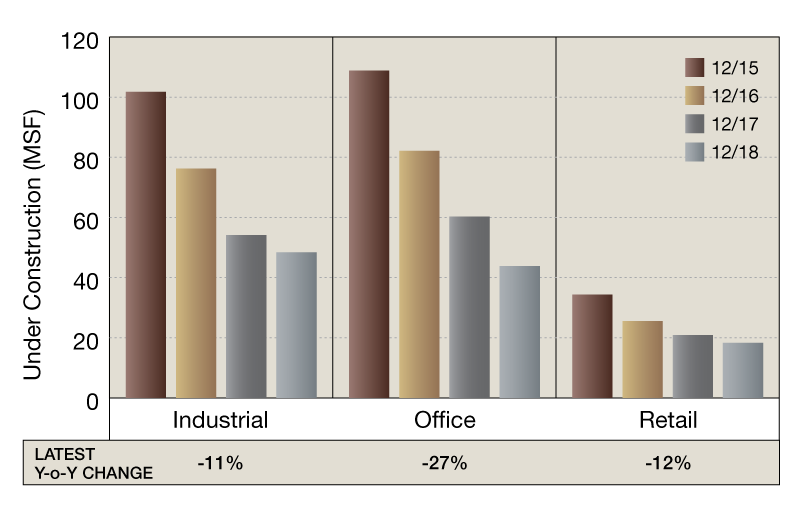
Source: CoStar Group Inc.
On a square foot basis, new development decreased for all property types year-over-year. Office construction fell by 27 percent, retail development dropped by 12 percent and industrial followed with a 11 percent decline as of December. The share of retail properties under construction decreased by 5.1 percent month-over-month, followed by industrial assets with a 1.6 percent decline. Development activity for office properties registered a modest decrease of 0.7 percent. Taking into account the past four years, the industrial sector peaked in December 2015 at 101.8 million square feet. Construction decreased by 25 percent in comparison with the same month in 2016. Comparing December 2015 to the same month of 2017, the industrial sector experienced a 46.8 percent drop, followed by a 52.4 percent decline in December 2018.
—Posted on Jan. 11, 2019
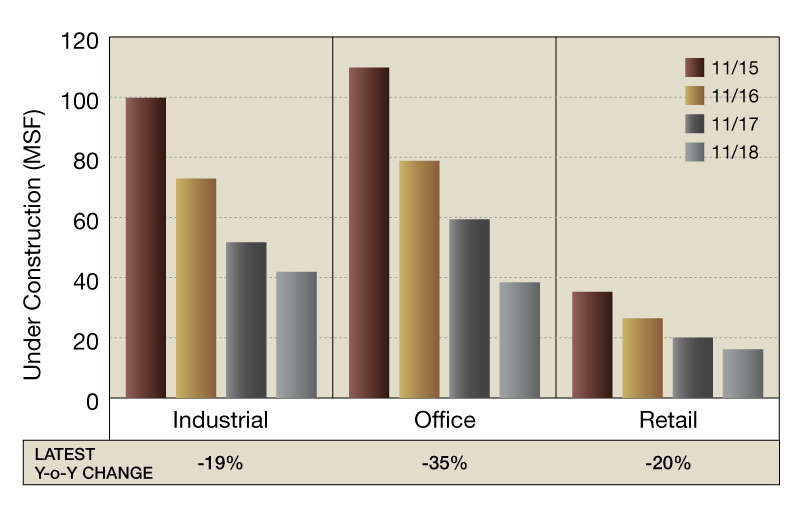
Source: CoStar Group Inc.
Year-over-year though November, new development decreased for all property types on a square-foot basis. Office construction decreased by 35 percent, retail development fell by 20 percent and industrial followed with a 19 percent drop as of November. The percentage of retail properties under construction decreased by 17.2 percent month-over-month, followed by office assets with a down by 16.1 percent decline. Development activity for industrial properties registered a decrease 12.8 percent. In the past four years, the retail sector peaked in November 2015 at 35.3 million square feet. In comparison with the same month in 2016, construction decreased by 25 percent. Comparing November 2015 to the same period in 2017, the retail sector experienced a 75.8 percent drop, followed by a 54.2 percent decline in November 2018.
—Posted on Dec. 14, 2018
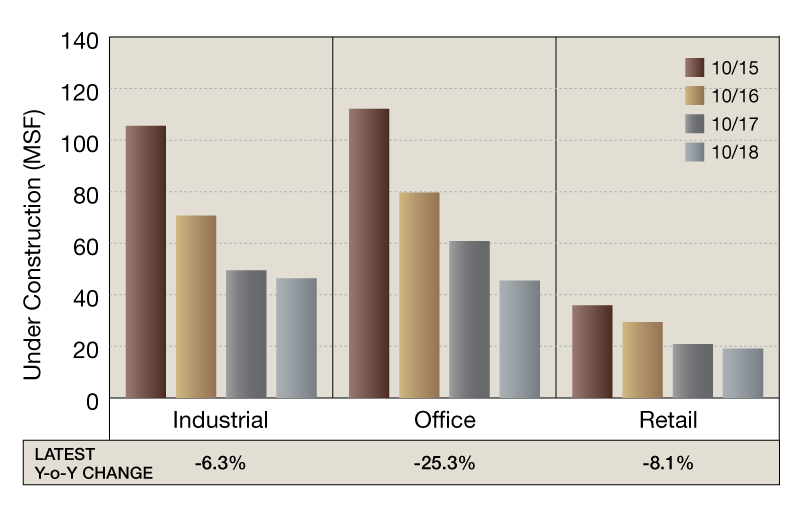
Source: CoStar Group Inc.
New development on a square foot basis decreased for all property types compared to October 2017. Office construction fell by 25.3 percent, retail development decreased by 8.1 percent, and industrial followed with a 6.3 percent drop. The share of office properties under construction decreased by 6.8 percent month-over-month, followed by industrial assets at a 3 percent decline. Development activity for retail properties experienced a modest decrease of 1 percent. The office sector peaked in October 2015 at 112 million square feet. Comparing October 2015 to the same period in 2018, the office sector experienced a 59 percent decline in construction activity.
—Posted on Nov. 9, 2018

Source: CoStar Group Inc.
Year-over-year, new development decreased for all property types on a square foot basis. Office construction decreased by 25.0 percent, retail development fell by 8.0 percent and industrial followed with a 6.0 percent drop. The percentage of office properties under construction decreased by 6.8 percent month-over-month, followed by industrial assets (3.0 percent decline). Development activity for retail properties registered a slight decrease (down 1.0 percent). The office sector peaked in October 2015 at 112.1 million square feet, compared to the same month in 2016, when it decreased by 29 percent. Comparing October 2015 to the same period in 2017, the office sector experienced a 45.7 percent drop, followed by a 59.5 percent decline in October 2018.
—Posted on Oct. 11, 2018
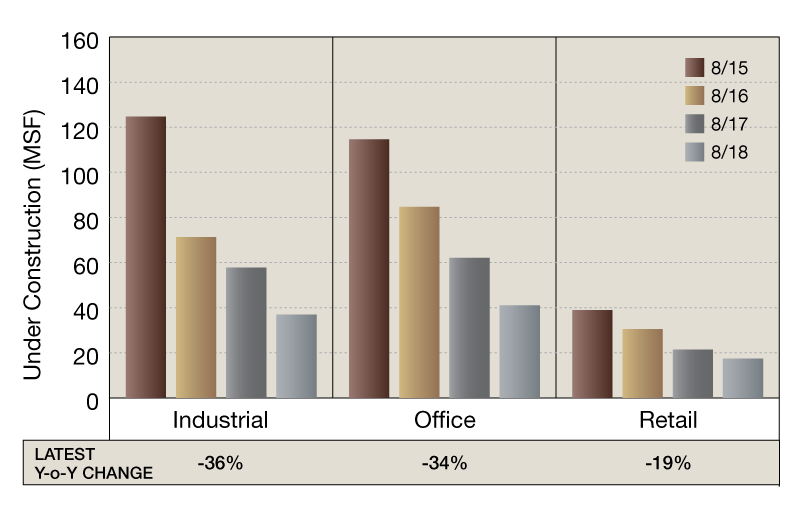
Source: CoStar Group Inc.
New development decreased for all property types on a square foot basis year-over-year. Industrial construction fell by 36 percent, Office development decreased by 34 percent, and Retail followed with a 19 percent drop. The percentage of Retail properties under construction decreased by 14 percent month-over-month, followed by Industrial assets with a 13.5 percent decline. Development activity for Office properties posted the smallest decrease—nearly 6 percent. The retail sector peaked in August 2015 at 140.9 million square feet, compared to the same month in 2016, when it decreased by 22 percent. Comparing August 2015 to the same period in 2017, the retail sector declined by 45 percent, and by 55 percent in August 2018.
—Posted on Sep. 13, 2018
Source: CoStar Group Inc.
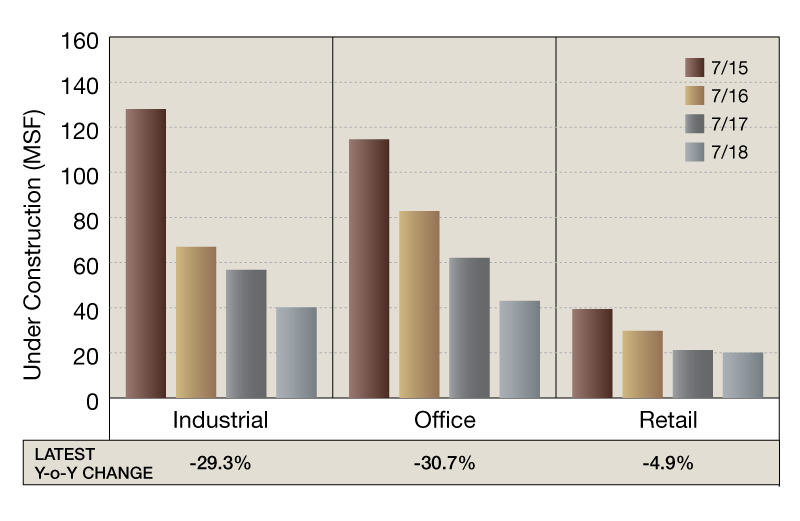
New development decreased for all property types on a square foot basis year-over-year. Office construction fell by 30.7 percent, Industrial development decreased by 29.3 percent and Retail followed with a 4.9 percent drop. The percentage of Office properties under construction decreased by 10.9 percent month-over-month, followed by Industrial assets (down by 10.7 percent). Development activity for Retail properties experienced a 2.0 percent increase. The office sector peaked in July 2015 at 114.6 million square feet, compared to the same month in 2016, when it decreased by 27.7 percent. Comparing July 2015 to the same period in 2017, the office sector experienced a 45.8 percent drop, followed by a 62.4 percent decline in July 2018.
—Posted on Aug. 15, 2018

Source: CoStar Group Inc.
New development decreased for all property types on a square foot basis year-over-year. Industrial construction fell by 53.4 percent, Office development decreased by 49.2 percent and Retail followed with a 28.6 percent drop. The share of Industrial properties under construction decreased by 19.4 percent month-over-month in June, followed by Office assets with an 18.6 percent decline. Development activity for Retail properties experienced the smallest decrease of 5.7 percent. The industrial sector peaked in June 2015 at almost 141 million square feet, compared to the same month in 2016, when it decreased by 48.9 percent. Comparing March 2015 to the same period in 2017, the industrial sector experienced a decline of 57.3 percent, followed by a decrease of 80.1 percent in June 2018.
—Posted on July 11, 2018
Source: CoStar Group Inc.
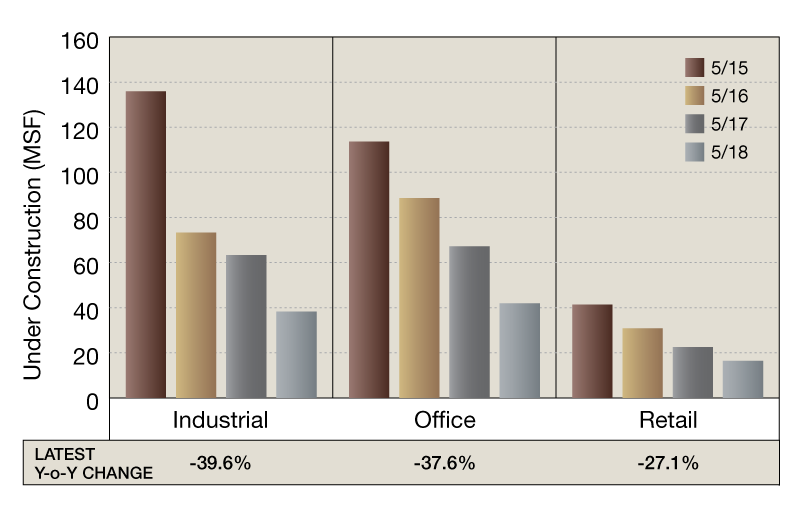
New development on a square foot basis decreased for all property types compared to May 2017. Industrial construction fell by 39.6 percent, Office development decreased by 37.6 percent, and Retail followed with a 27.1 percent drop. The share of Industrial properties under construction decreased by 18.5 percent month-over-month, followed by Office assets at a 12.7 percent decline. Development activity for Retail properties registered a decrease of 11.8 percent. The retail sector peaked in May 2015 at 41.4 million square feet, compared to the same month in 2016, when it decreased by 25.4 percent. Comparing May 2015 to the same month in 2018, the retail sector experienced a 60.4 percent decline in construction activity.
—Posted on June 19, 2018
Source: CoStar Group Inc.
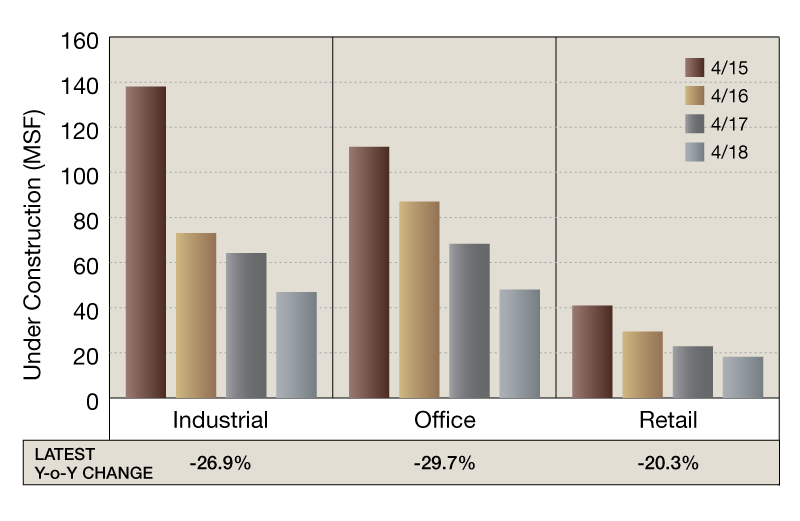
New development decreased for all property types on a square-foot basis compared to April 2017. Office construction dropped by 30.0 percent, Industrial development fell by 27.0 percent, and Retail followed with a 20.0 percent decrease. The percentage of Office properties under construction decreased by 3.2 percent month-over-month, followed by Retail assets with a 2.0 percent drop. Development activity for Industrial properties posted a minor increase of 3.0 percent. The office sector peaked in April 2015 at 111.3 million square feet, compared to the same month in 2016, when it decreased by 21.8 percent. Comparing April 2015 to the same period in 2018, the office sector was on a continued downward trajectory, experiencing a 56.9 percent decline in construction activity.
—Posted on May 15, 2018
Source: CoStar Group Inc.
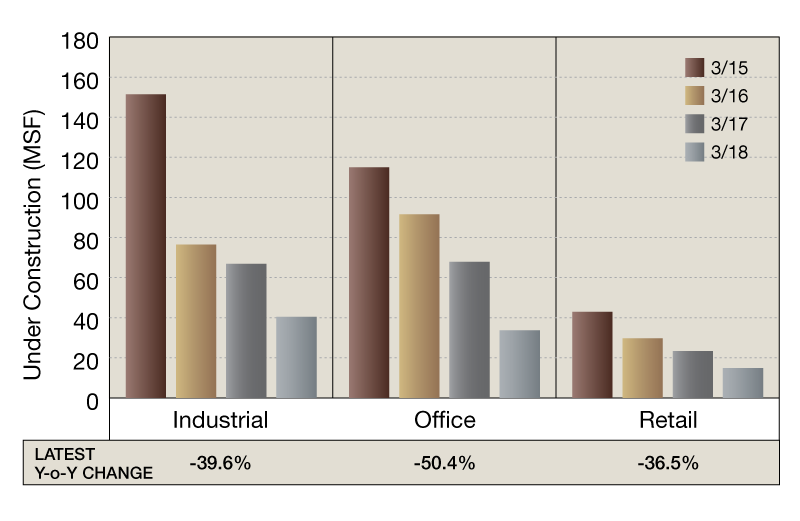
New development on a square foot basis decreased for all property types compared to January 2018. Office construction fell by 50.4 percent, Industrial development decreased by 39.6 percent and Retail inched down 36.5 percent. The percentage of Industrial properties under construction decreased by 13.4 percent month-over-month, followed by Retail assets at an 8.3 percent decline. Development activity for Office properties experienced the most significant decrease of 16.1 percent. The industrial sector peaked in March 2015 at 151.4 million square feet, but decreased by 49.5 percent in the same month of 2016. Comparing March 2015 to the same period in 2018, the industrial sector experienced a 73.3 percent decline in construction activity.
—Posted on April 18, 2018

Source: CoStar Group Inc.
New development decreased for all property types on a square foot basis compared to January 2018. Industrial construction dropped by 36.0 percent, while Office development fell by 40.0 percent and Retail by 35.0 percent. On a month-over-month basis, the share of Office properties under construction decreased by 21.4 percent, followed by Retail assets at a 15.9 percent decline. Construction activity in the Industrial sector dropped by 11.1 percent compared to January 2018. The retail sector peaked in February 2015 at 44.7 million square feet, but declined by 34.8 percent in the same month of 2016 , followed by a 18.3 percent drop in February 2017.
—Posted on Mar. 19, 2018

Source: CoStar Group Inc.
New construction decreased for all property types on a square foot basis compared to January 2018. Industrial development fell by 26 percent, Office construction decreased by 27 percent and Retail experienced a 22 percent decline. On a month-over-month basis, the share of Industrial properties under construction fell by 4.8 percent, while Office developments decreased by 6.7 percent. Retail construction experienced the most considerable decline, with a 10.7 percent drop. The Industrial sector peaked in January 2015 at 158.9 million square feet, but dropped at almost 50 percent in the same month in 2016, and lost another 15.6 percent in January 2017.
—Posted on Feb. 21, 2018

Source: CoStar Group Inc.
New development on a square foot basis decreased for all property types compared to December 2017. Industrial construction fell by 39.0 percent, Office development decreased by 33.0 percent, and Retail didn’t lag far behind with a 32 percent drop. The share of Industrial properties under construction decreased by 8.2 percent month-over-month, followed by Office assets at a 3.5 percent decline. Development activity for Retail properties experienced the most significant decrease of 10.8 percent. The industrial sector peaked in December 2014 at 168.5 million square feet, but dropped by 43.8 percent in the same month of 2015. Comparing December 2015 to the same month of 2016, the industrial sector experienced a 25.1 percent decline in construction activity.
—Posted on Jan. 30, 2018


You must be logged in to post a comment.