

CMBS Walks a Fine Line in 2017
This year promises to be a transitional one for CMBS, as issuers not only attempt to comply with new regulations but also face the concern that the recovery of the economy and real estate fundamentals will run out of steam, notes Yardi Matrix Associate Director of Research Paul Fiorilla.
By Paul Fiorilla, Associate Director of Research, Yardi Matrix

CMBS was bound to face a transitional year in 2017. The market is dealing not only with a new regulatory environment, but also the widespread perception that commercial real estate values are peaking and fundamentals are due to cool.
After a shaky start, volume has largely recovered compared to a year ago, and metrics such as loan quality and bond prices look favorable. Still, the market must deal with regulatory changes, a shrinking investor base and concerns about the state of real estate fundamentals—challenges that won’t be quickly resolved.
CMBS issuance was at $27.0 billion as of May 26, down 6.6 percent from a year ago, according to Commercial Mortgage Alert. CMBS quality metrics have improved since risk-retention rules started being implemented in the second half of 2016, which require issuers to hold 5 percent of securities. (The requirements went into effect in late December 2016, but some securitization programs began to comply as early as August.)
For example, loan-to-value (LTV) and debt-service coverage (DSC) ratios have improved. The average issuer LTV of pooled conduit deals through May 26 was 58.7 percent, down from 60.0 percent in 2016, 64.4 percent in 2015, and 65.5 percent in 2014. DSC levels have averaged 2.0 in 2017, the same as 2016, and up from 1.8 in 2015 and 1.7 in 2014.
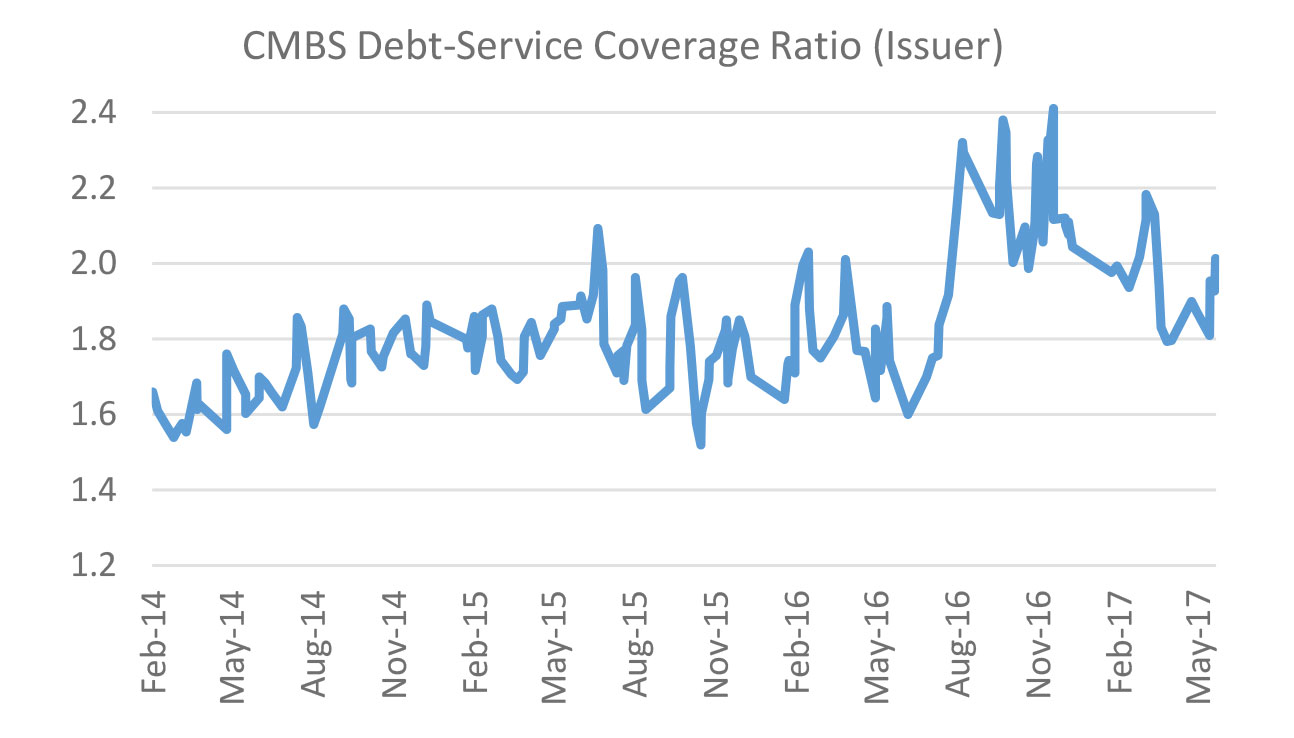
Sources: Commercial Mortgage Alert, Yardi Matrix
It would be easy to largely attribute the improvement in quality to the implementation of risk-retention regulations, which were intended to make securitization programs “eat their own cooking,” so to speak. While risk retention undoubtedly is a major influence on loan underwriting trends, other factors—such as investor sentiment, the unintended impact of regulations and the real estate cycle—also play a role.
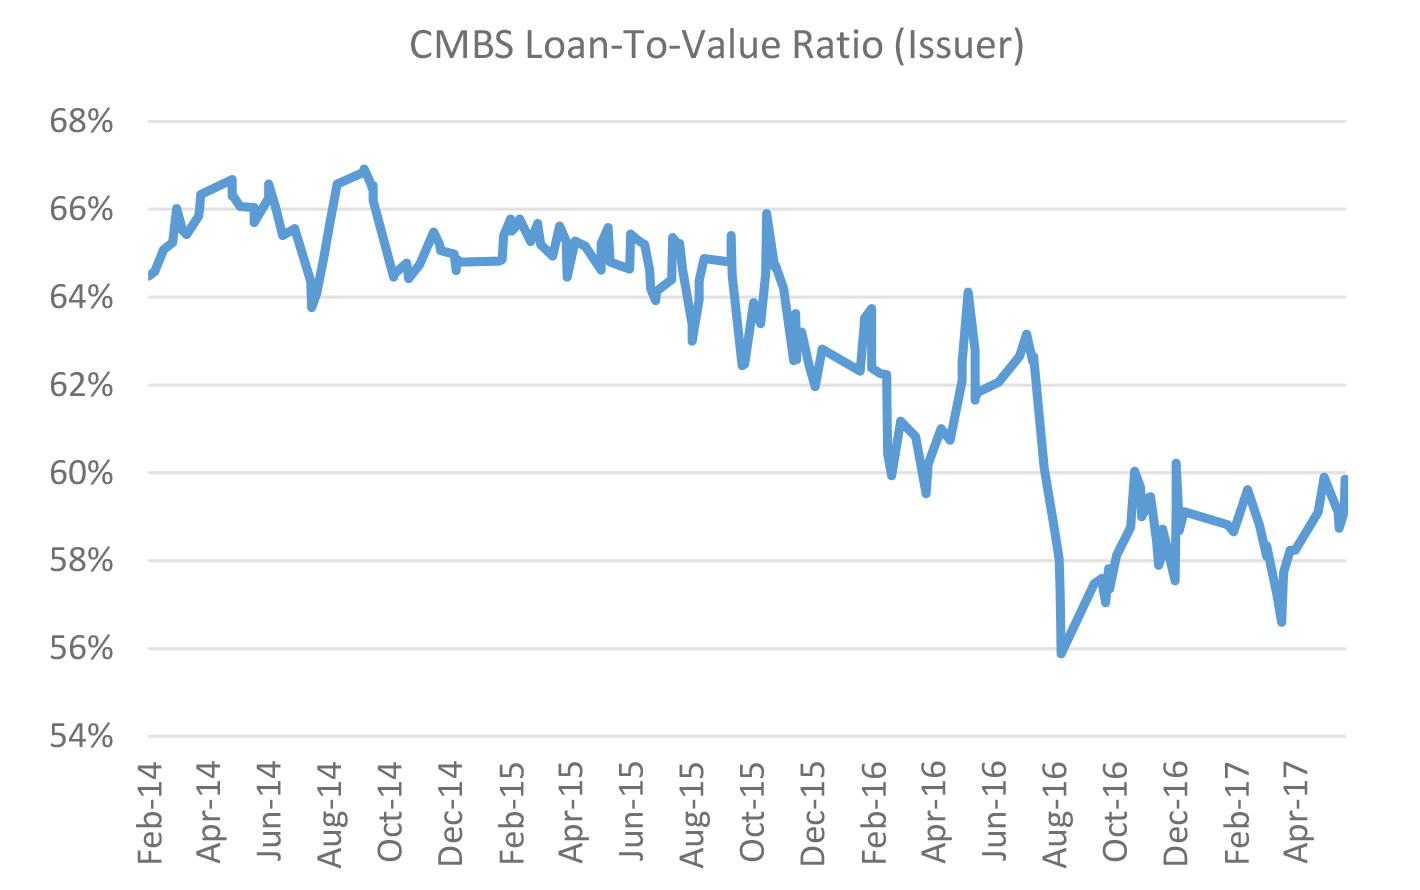
Sources: Commercial Mortgage Alert, Yardi Matrix
Some of the major factors include:
Risk retention: Three basic options have emerged for CMBS issuers to comply with the risk-retention regulations. One, called vertical, is for the loan contributors to maintain a 5 percent portion of each class. A second option, horizontal, is to sell the bottom 5 percent of the securities to a qualified investor known as a B-piece buyer. This is the closest to the way the industry worked in the past. The third option called “L-shaped,” is a combination of the vertical and horizontal structures.
The first risk-retention-compliant transaction issued last summer used the vertical structure. It was deemed a success, as investors paid high prices for the bonds. Since then, issuers have sampled the structures. Conduit deals, which feature a broad mix of loans, were roughly even. Through May 26, seven deals totaling $5.6 billion employed the vertical structure, five deals totaling $4.8 billion employed the horizontal structure and five deals worth $5.1 billion employed the L-shaped structure. Horizontal dominated the single-borrower market, with seven deals totaling $4.6 billion, while six deals worth $3.0 billion employed the vertical structure.
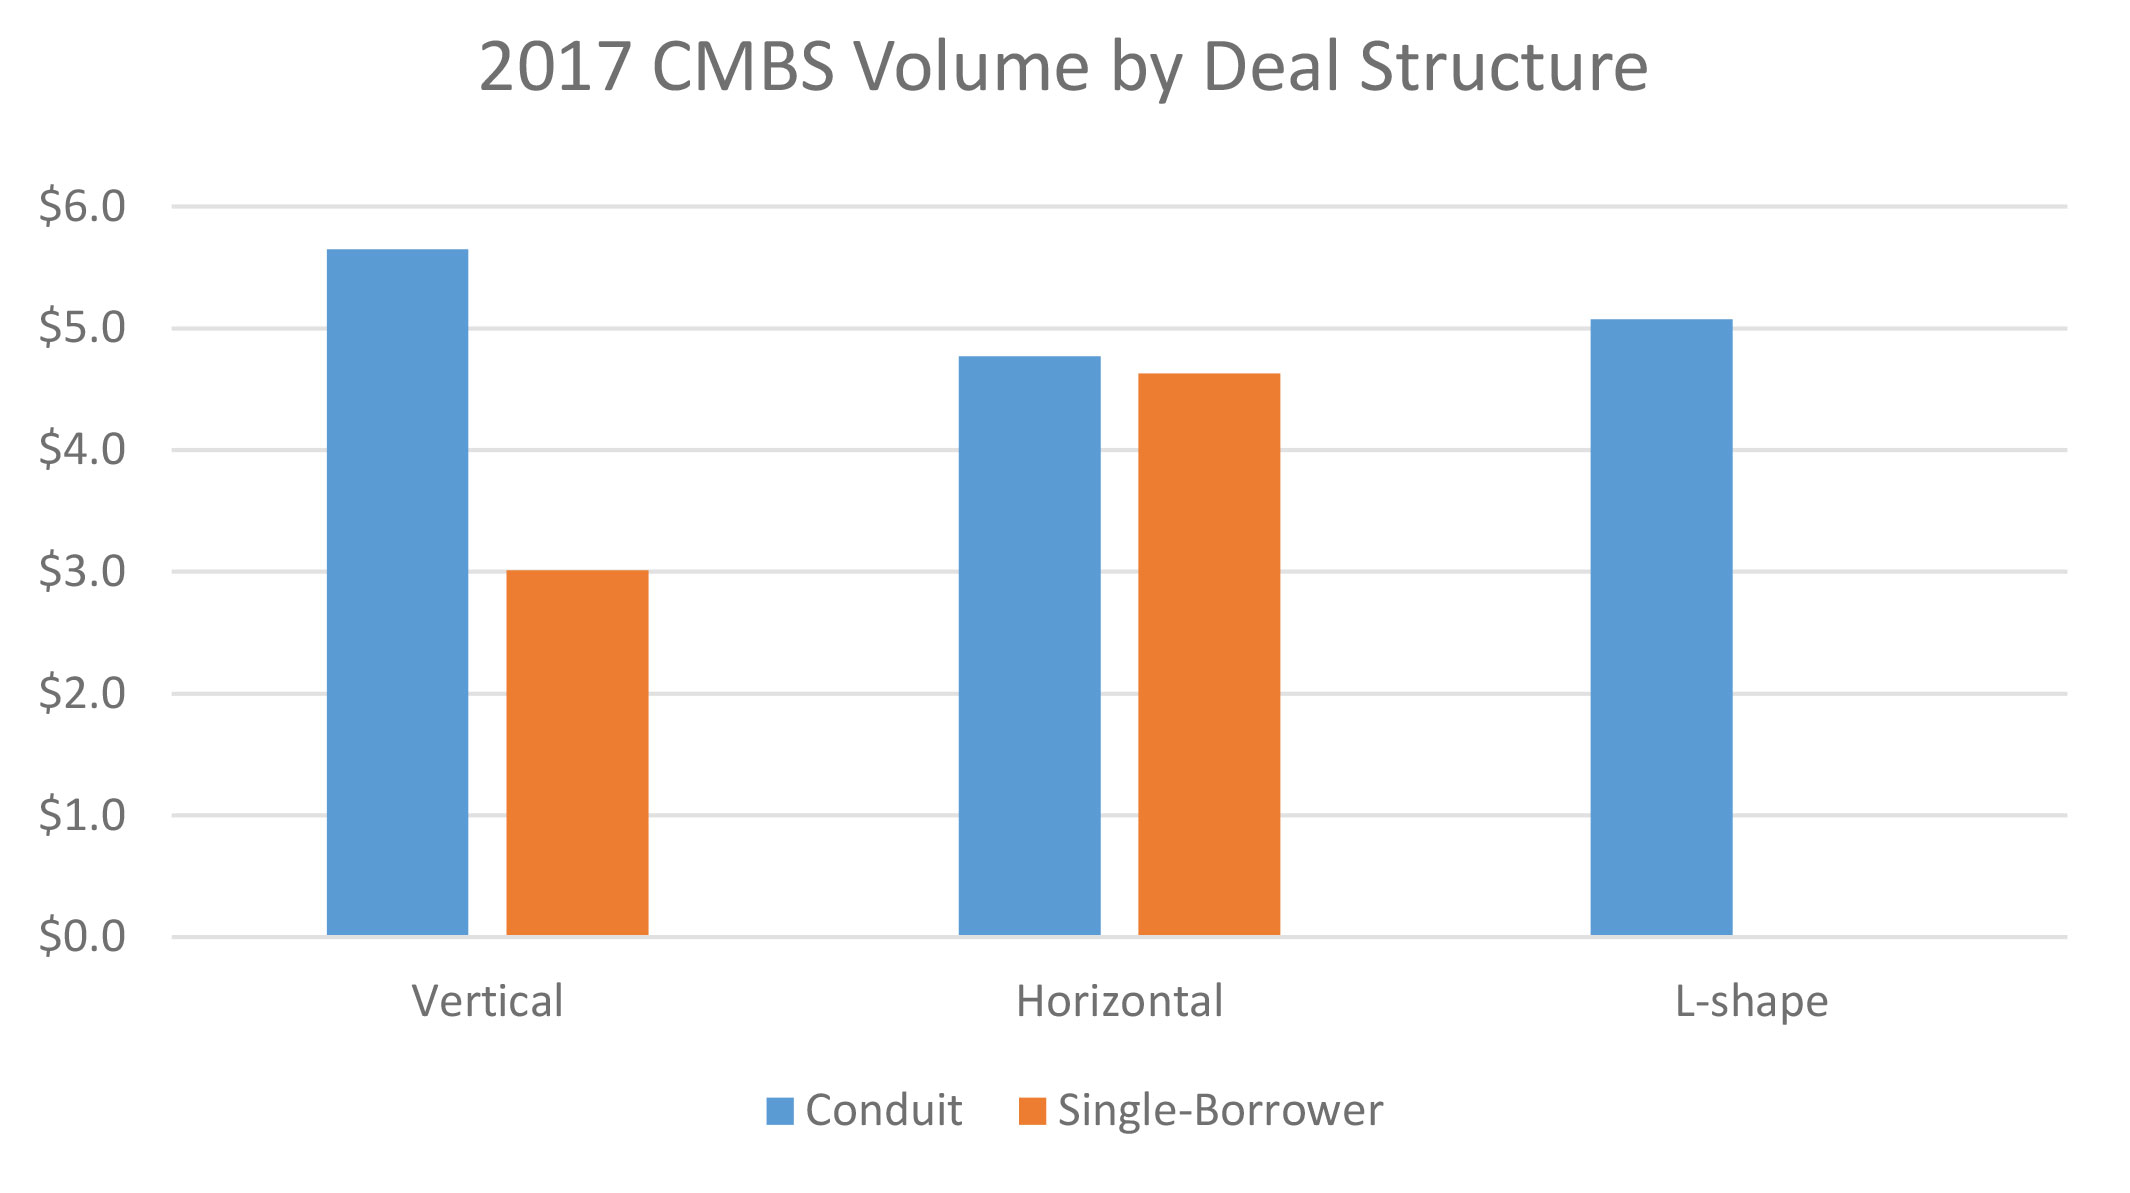
Note: Data as of May 26, 2017. Sources: Commercial Mortgage Alert, Yardi Matrix
One consequence of risk retention is it favors larger banks with bigger balance sheets. Large institutions have the resources to hold securities on their portfolio, and they are reluctant to team up with originators that don’t have the same ability. That has prompted at least 10 of the specialty lenders or smaller banks that contributed collateral to CMBS pools in recent years to drop out of the market.
Fewer investors: When the market was preparing for risk retention, concern was focused on whether there would be enough investor demand for the B-piece, or junk-rated, classes of CMBS pools. Those fears have not materialized, as there is—at least for now—an active group of high-yield investors. However, the number of buyers for the AAA-rated classes has shrunk, which gives them more leverage to demand better collateral.
Why has the number of investment-grade buyers declined? The most common theory is the reduction in liquidity brought about by rules that constrain banks’ proprietary trading. Banks can buy CMBS to support the market, as opposed to making profits, but there are fewer willing to serve that function, and the resulting loss of liquidity has led some investors to leave the market.
Another theory is that it is more difficult for investors to finance bond purchases than it was before the financial crisis, which means fast-money players have disappeared and left the AAA investor base concentrated in all-cash or low-leverage buyers. In other words, buyers of senior bonds tend to be institutions that want less risk and are not shy about expressing those needs to issuers.
CMBS spreads have trended steadily downward for more than a year, in part due to demand for deals with risk retention. Ten-year, AAA-rated CMBS priced to yield as much as 116 basis points over swap spreads in the fourth quarter of 2016. Since risk retention went into effect in late December, spreads have generally been between 90 and 95 basis points.
“Investors are willing to pay up for lower leverage,” said one CMBS portfolio manager. “That’s what the market wants.”
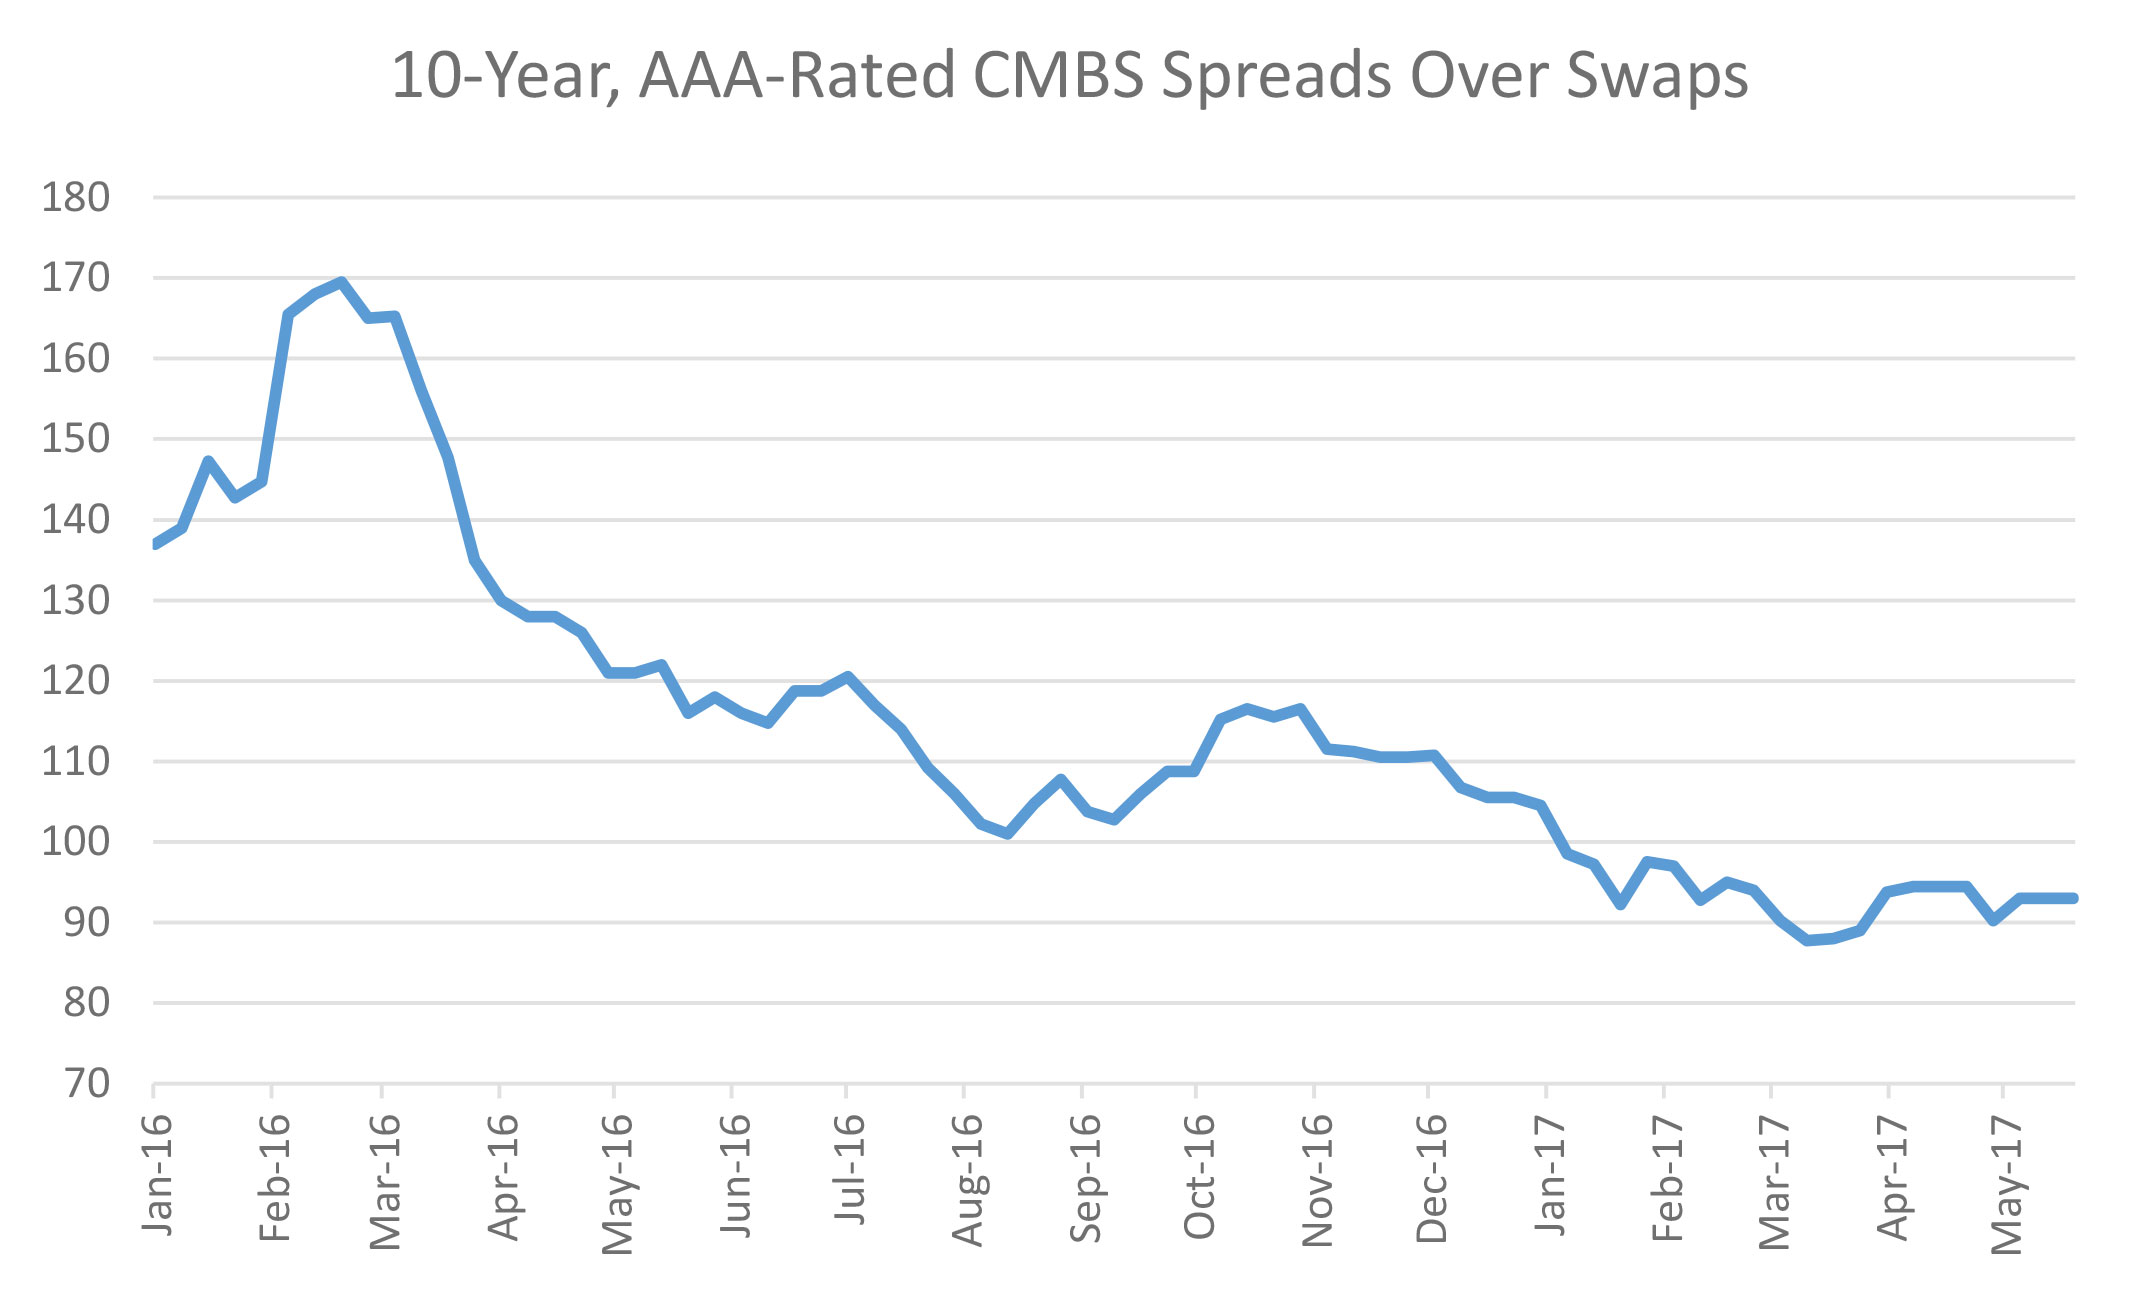
Source: Commercial Mortgage Alert
Fundamental concerns: Another factor is the growing concern that the commercial real estate market has peaked and bond buyers don’t want exposure to high-leverage assets. The general feeling is commercial property prices have hit all-time highs, acquisition yields are at all-time lows, and rent growth is about to slow down in the face of rising construction and/or slowing occupier demand. For example, U.S. multifamily rent growth has slowed to 1.5 percent year-over-year through May, after being up as much as 5.6 percent in 2016, according to Yardi Matrix.
What’s more, there are heightened fears about the long-term prospects of certain sectors, such as retail and hotel, leading investors to exercise heightened due diligence on any collateral in those asset classes. Even though few believe the market has entered bubble territory and will see a 2008-like crash, industry players still have fresh memories about buying at the peak of the 2007 cycle, and at the very least want to exercise caution.
Competitive landscape changing
Nobody doubts the need for a healthy CMBS market, and defaults are unquestionably a negative for the market, but the question is how the industry’s health is measured: by volume, or by how well it services the needs of borrowers? CMBS loans originated to withstand more stress are largely a virtue, but there are consequences. Some worry the market’s focus on better-quality product may reduce debt availability for marginal assets. Throughout its history, CMBS has been the lender of choice for properties in secondary and tertiary markets, and for B- and C-quality assets.
Life companies dominate the market for low-leverage loans on high-quality properties because they can offer lower loan spreads, and borrowers prefer the more personalized servicing they provide compared to CMBS.
“A life company will always take down a loan if they want it, that hasn’t changed,” said one mortgage broker.
Market players say CMBS still wins deals in which borrowers want the most proceeds and the longest term. Commercial banks typically prefer terms of less than seven years, giving CMBS an advantage for 10-year loans. CMBS lenders are also increasing their use of interest-only (IO) periods. Rating agency KBRA’s “IO Index” tracks the weighted-average number of months of IO periods in CMBS pools. For conduit-loan pools, the average has risen to 50 months in 2017, from 39 months in 2015.
CMBS programs must be careful with the mix of loans, as investors are likely to avoid deals in which the collateral is heavily weighted on more risky property types such as retail and hotels. The upshot is that some marginal loans will shift from CMBS executions to local banks or private equity funds.
Walking a fine line
Given a business model in which pricing and liquidity can change daily, CMBS is always more dependent on market forces than competing lenders. The market is navigating a fine line between originating loans with prices and terms that will appeal to borrowers and can be sold to an increasingly choosy investor base. At the same time, CMBS is trying to comply with new rules—while lobbying to relax those rules—and holding its breath that the recovery in the economy and real estate fundamentals doesn’t run out of steam.
Volume is holding up for the time being— as there is demand to finance transactions and the large number of 2007-vintage loans that are coming due—but there are no guarantees.


You must be logged in to post a comment.