2018 Cap Rates
National cap rate performance comparing a three-month and 12-month basis-point change across all property sectors, updated quarterly.
Based on properties and portfolios of $2.5 million and greater
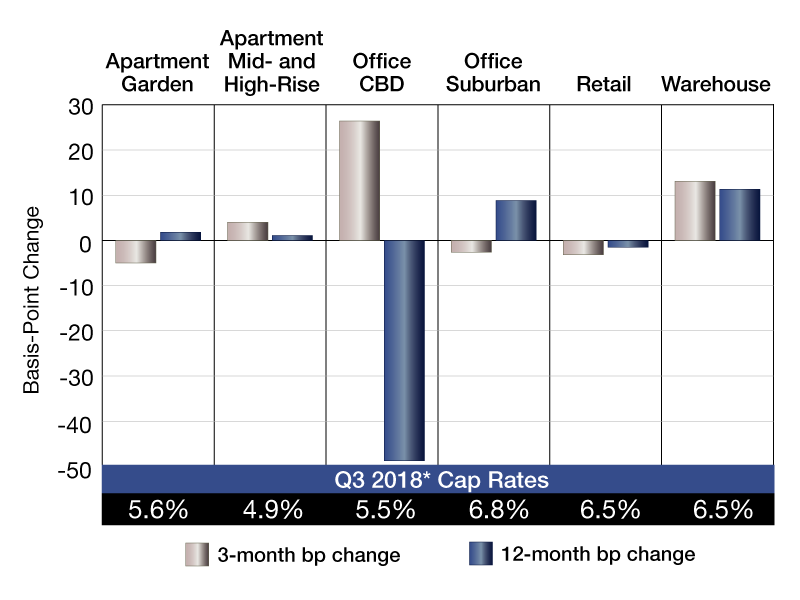
*Data current through 9/30/2018.
Source: Real Capital Analytics Inc., www.rcanalytics.com
Cap rates for the third quarter were between 4.9 and 6.8 percent, with Suburban Office, Warehouse and Retail posting the highest rates. Mid- and High-rise Apartments traded at the lowest cap rates (4.9 percent), followed by CBD Office at 5.5 percent. Office CBD cap rates increased by 26.4 basis points in the third quarter of the year, while Warehouse increased by 13.1 basis points. Year-over-year, Warehouse assets recorded the highest growth rate for commercial properties (11.3 basis points) and the most significant decrease was for Office CBD properties ( down 48.7 basis points). The most substantial increase in residential properties year-over-year was 1.8 basis points for Garden Apartments, while cap rates for Mid- and High-rise Apartments expanded by 1.1 basis points.
—Posted on Dec. 14, 2018
Based on properties and portfolios of $2.5 million and greater
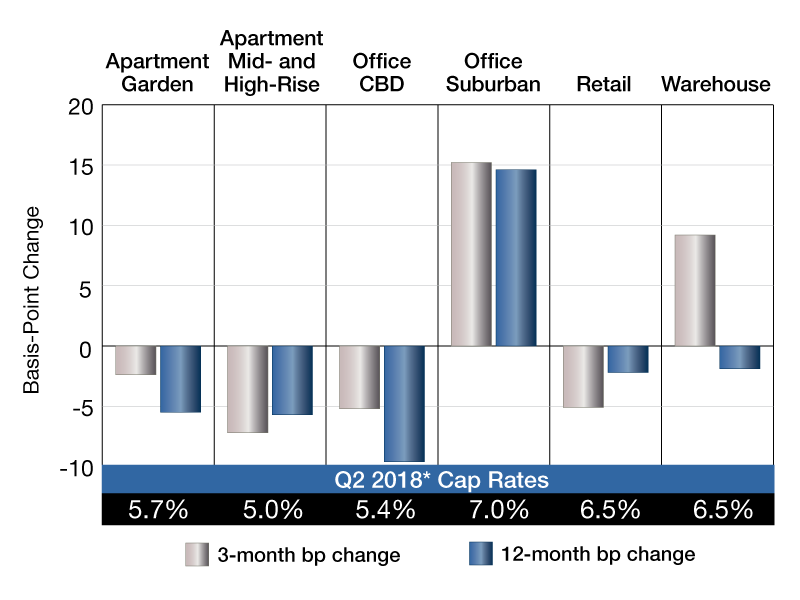
*Data current through 6/30/2018.
Source: Real Capital Analytics Inc., www.rcanalytics.com
Cap rates for the second quarter were between 5.0 and 7.0 percent, with Suburban Office, Retail and Warehouse posting the highest rates. Mid- and High-rise Apartments traded at the lowest cap rates (5.0 percent), followed by CBD Office at 5.4 percent. Office CBD cap rates increased by more than 15 basis points in the second quarter of the year, while Warehouse increased by 9.2 basis points. Year-over-year, Suburban Office assets recorded the highest growth for commercial properties (14.6 basis points) and the most significant decrease was for Office CBD properties (-9.6 basis points). The most substantial drop in residential properties year-over-year was 5.7 basis points for Mid- and High-rise Apartments, while Garden Apartment cap rates decreased by 5.5 basis points.
—Posted on Sep. 13, 2018
Based on properties and portfolios of $2.5 million and greater
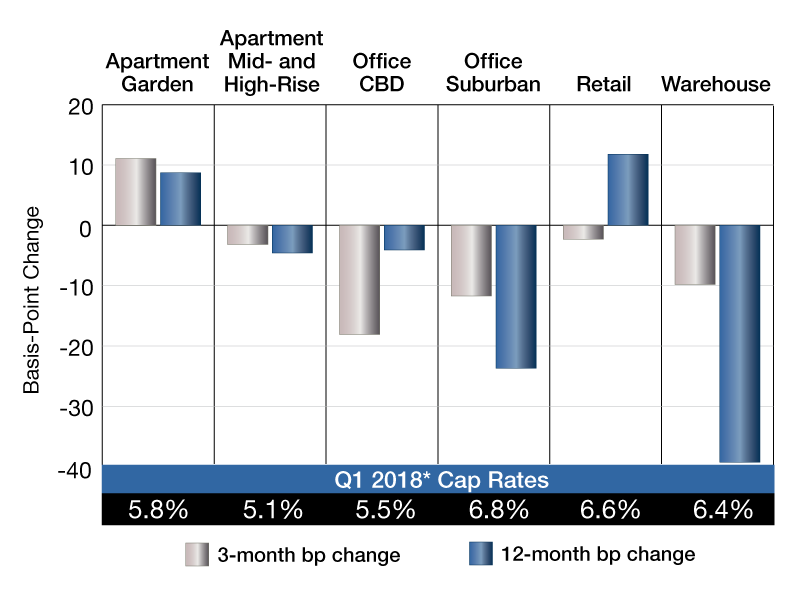
*Data current through 3/31/2018.
Source: Real Capital Analytics Inc., www.rcanalytics.com
Cap rates for the first quarter were between 5.1 and 6.8 percent, with Suburban Office and Retail posting the highest rates. Mid- and High-rise Apartments traded at the lowest cap rates (5.1 percent), followed by CBD Office at 5.1 percent. Garden Apartment cap rates increased by more than 11 basis points in the first quarter of the year, while CBD Office decreased by 18.1 basis points and Suburban Office fell by 11.7. Year-over-year, Retail assets commanded the highest growth for commercial properties (11.8 basis points). The most significant decrease was for Warehouse facilities, down 39.3 basis points. The most substantial drop in residential properties year-over-year was 4.6 basis points for Mid- and High-rise Apartments, while Garden Apartment cap rates increased by 8.7 basis points.
—Posted on June 19, 2018


You must be logged in to post a comment.