Michelle Matteson
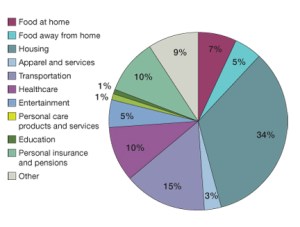
Senior Spend
Where Senior Dollars Go (spending on consumer goods by households age 55 to 74) For those in the 55-to-74 age bracket, the category-by-category breakdown of spending reveals the changing needs of the population. Healthcare makes up about 10 percent of those costs; food consumed at home is about 7 percent, dining out accounts for 5 percent, and apparel and services make up 3 percent of the total. About 1 percent of expenditures for those 55 to 74 are for personal care products. * * * Mature Consumers’ Favorites (top retail categories in 68 counties with high senior concentrations and fast-growing…
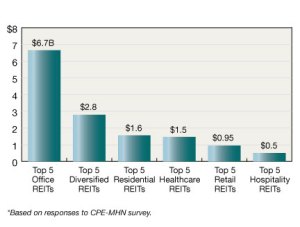
Top REITs: Still in Office
(change in total asset value, $ in billions, 2009 to 2010*)
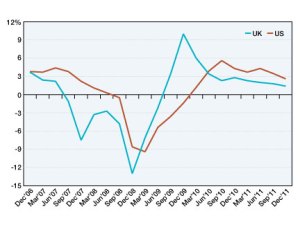
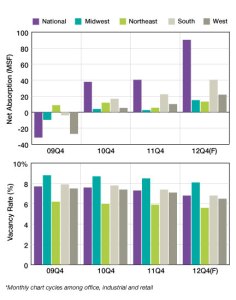
Retail Leasing
(U.S. retail market conditions*) *Monthly chart cycles among office, industrial and retail
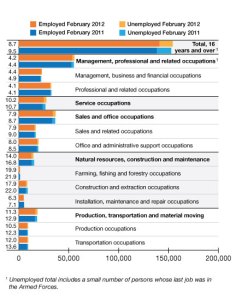
U.S. Employment by Occupation
(employed and unemployed persons by occupation; not seasonally adjusted; numbers in thousands)
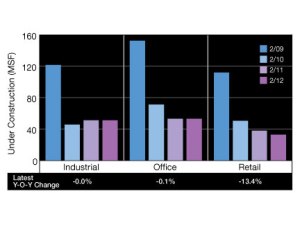
Manufacturing Update
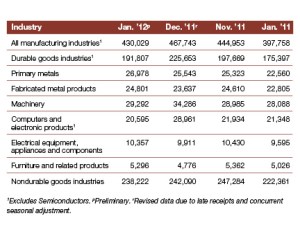
(value of manufacturers’ new orders; not seasonally adjusted; $ in millions)