



Michelle Matteson
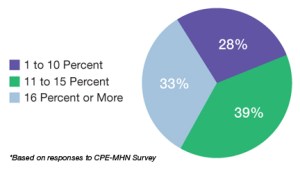
Greenest CRE Firms: Energy-Wise
(reduction in portfolio-wide energy costs over past five years*)
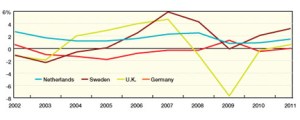
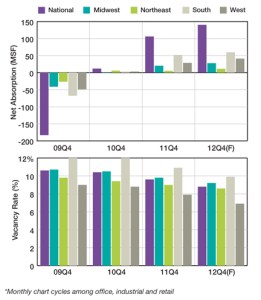
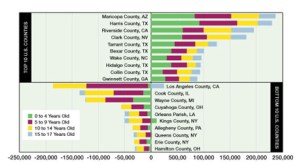
Demographics
(top and bottom counties based on change in population under age 18, 2000 to 2012)
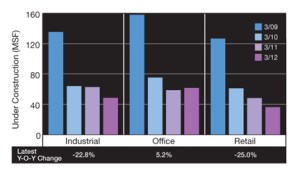
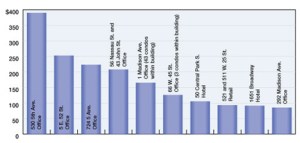
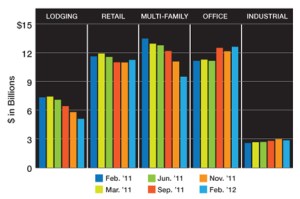
New York City Spotlight: Top Dollar
(top 10 New York City commercial transactions, January 1 to March 30, 2012; $ in millions)
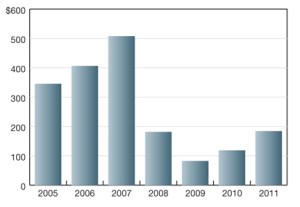
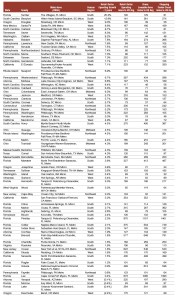
High Spenders
(retail spending patterns and gross leasable area/shopping center indices) This chart ranks the 68 U.S. counties that demonstrate both higher-than-average concentrations of consumers age 55 to 74 and retail spending that is above the national average. The index numbers reflect the relative concentration of shopping centers and gross leasable area of retail space per person in each county. Given the high proportion of consumers 55 to 74 in the top 68 counties, owners should consider stores and product types that appeal to people in that age bracket. Counties where inventories of centers and/or retail space are below average may be…
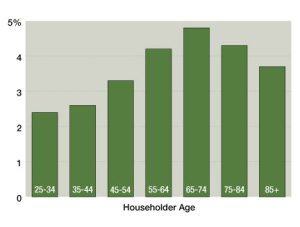
Income Gains
(increases in average household income, 2012-2017) Between 2012 and 2017, households headed by older Baby Boomers will demonstrate the largest income gains of any age brackets. Household income will grow faster among older Baby Boomers than in households headed by people age 25 to 54. Topping the list are people age 65 to 74, who will gain 4.8 percent on average, according to Nielsen Co. research, as their incomes rise to $39,162. In households led by Baby Boomers age 55 to 64, income will rise 4.3 percent on average, to $56,698. Measured in absolute terms, the 45-to-54 group will reach…