



Michelle Matteson



The August digital issue of CPE is now available!
Read the latest August news here!
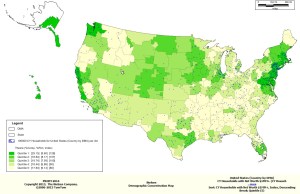
Buyer’s Market
By Allie Putterman In the map shown, the Nielsen Designated Market Areas in dark green have households that are 1.26 times more likely than the average to have a net worth of $1 million or more. On average, 9.6 percent of households in these areas have this high net worth. Together, all DMAs in dark green comprise more than one-quarter of the high-net-worth households in the U.S. In contrast, areas in light green, or Quintile 5, are 20 percent less concentrated in these high-net-worth households and capture only 6 percent of them, nationwide, even though these same areas make up…
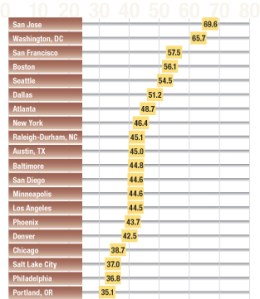
Tech Talent Scorecard: Where Are the Best and Brightest?
Today’s technology sector relies on innovation, venture capital and, most of all, talent. CBRE Group Inc. assessed metropolitan areas nationwide to determine where the high-tech industry is finding the knowledge workers that are its mainstay. CBRE evaluated each metro area in four major categories, starting with the technology labor market; that includes the supply of technology workers, labor costs and supply change from 2010 to 2012. Next, the local knowledge pipeline assesses technology-related university degree completions and academic R&D completions. The scorecard also rates each metro area’s technology sector for the number of tech workers and five-year technology job outlook….

Tight and Tighter
(national cap rate performance based on properties and portfolios of $2.5 million and greater)

Second-Quarter Slump?
Value of manufacturers’ new orders; not seasonally adjusted; $ in millions

Slightly Spring-ier
(employed and unemployed persons by occupation; not seasonally adjusted; numbers in thousands)

You must be logged in to post a comment.