April Issue: Trend–From the Milky Way to Midtown, A New Way to See a City
The glare of city lights dims the stars for urban dwellers around the world, but a New York University program is borrowing an idea from astronomy to see its hometown in a new way.
 By Anna Spiewak, Senior News Editor
The glare of city lights dims the stars for urban dwellers around the world, but a New York University program is borrowing an idea from astronomy to see its hometown in a new way. If the experiment lives up to its early promise, it will yield a tool that will help urban buildings everywhere be more sustainable.
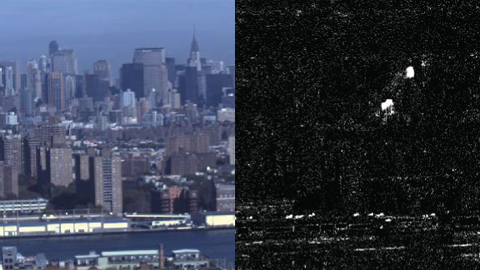
At a first-of-its-kind “urban observatory” created by NYU’s Center for Urban Science and Progress, a special high-tech camera captures aspects of building performance that are invisible to the naked eye, such as heat leaks, energy efficiency and insulation. Though the project is still in the demonstration phase, it is expected to yield insights about building performance and urban life that will benefit both the public and private sectors.
CUSP’s urban observatory uses an eight-megapixel camera perched on top of a building in downtown Brooklyn to capture a panoramic image of downtown and midtown Manhattan every 10 seconds. Unlike a satellite, the CUSP camera offers both an unchanging perspective and easy, low-cost operation, according to the project team.
The big data generated by the CUSP observatory could be mined for solutions to urban problems, a promising development as populations become increasingly concentrated in cities.
“For the first time in history, 50 percent of the world is urban,” Maureen McAvey, senior resident fellow at the Urban Land Institute, told CPE. Fully 85 percent of the population of the United States is concentrated in metropolitan areas. Meanwhile, urban populations are rapidly expanding in Asia, Africa and South America.
“It’s terrific to have a university doing this, because they’re a non-profit, and their motive is usually educational and informational and offers assistance to the public,” she said.
Heat-Seeking Strategy
The project’s chief scientist, Gregory Dobler, is an astrophysicist by training. After a decade in his chosen field, he decided a year and a half ago to switch to an area that he felt offered more of a “real-world impact.”
While discussing the urban observatory project with Steven Koonin, CUSP’s founding director, Dobler realized that the basic data-gathering strategy was much the same as in astronomy: using repeated passive imaging to study a distant object. Rather than keeping watch on the Milky Way, however, the CUSP project observes Manhattan.
Recently, Dobler took a break from his busy schedule of data collection and analysis to discuss the technology behind NYU CUSP’s observatory with Commercial Property Executive.
CPE: Could you tell us why you decided to install this camera in Brooklyn, since you’re observing Manhattan? And why only one camera?
Dobler: The initial concept of the urban observatory was that we would be taking these observations of the city from afar and start figuring out what we could learn from it. In Brooklyn, we could get a nice view of Manhattan, which is a great place to start. There’s a large diversity of building heights, so when we’re taking images of the city from a distance, we can see a lot of buildings, there’s a broad diversity of all kinds of correlative data, and there’s a lot of record data.
We’re just starting, and we plan to develop more sites over time that have different views of Brooklyn, Queens, Staten Island and the Bronx. But we wanted to start out with one, and make sure the concept is viable (first).
CPE: How is this different than any other data?
Dobler: We have a camera that observes visible wavelengths similar to a camera in our phones. It has 10 million pixels, takes pictures in (red-green-blue) color. We also have a camera taking persistent imaging of New York City in infrared (light), which is used in building informatics. Infrared is the glow of the object itself. Buildings, coffee cups, people—we glow in the infrared. Light bounces off the object and hits you in the eye—that’s how you see objects in visible wavelengths.
That light is directly related to the temperature of the object you’re looking at. So things that are hotter have more infrared intensity than things that are colder. With an infrared camera, you can measure the temperature of objects. This is used in building inspections. You can take a picture and look for heat leaks, check for energy efficiency, assess whether the windows are leaking heat, because you’re essentially looking at the temperature of the building itself.
We can now take infrared images of huge portions of the city, hundreds and thousands of buildings in a single shot. You can start looking at heat transfer through the city—urban areas, which tend to be warmer than rural areas. You can also look for heat leaks in a population of buildings, rather than just one building. It’s taking thermographic building studies to the next level, so this is a real quantum leap in the understanding of heat in buildings.
CPE: What other effect would this have on real estate?
Dobler: Another example would be measuring insulation: How often is a building in direct sunlight? This is important for solar power consideration, and it’s also important for the real estate industry.
There are a couple of ways to do that: Shade can be cast on a building by other, taller buildings, so they’re not in direct sunlight, but that doesn’t tell you the whole story. In the observatory, we’re taking images of essentially the same thing every 10 seconds. We take a picture, wait 10 seconds, take another picture.
You can watch these pictures over time and see which building is in shadow and which isn’t. This is important for solar power, to know if a building will be covered in shadow.
CPE: To what extent will CUSP be linked to the NYC government?
Dobler: CUSP has strong partnerships with city agencies. Our hope here is that the types of things we learn here—the methodologies we’re developing—can be used by city agencies. For example, visible wavelength observations: By taking pictures every 10 seconds, you can see what’s changed in the past 10 seconds, what’s changed in the past minute—what things are staying the same and what things are changing.
When you do this, not only do you see cars and boats moving by on the highway or river, but you also start to see emission plumes coming out of buildings. When a boiler starts up, it spits out emission plumes. It’s hard to see that with the naked eye. But by doing data analysis, which is based on computer vision, you start to pick up these plumes that are coming out of these buildings.
This is directly linked to public health matters, such as air quality. This information can also be used by (the New York City Office of) Emergency Management: If there’s a toxic gas release, you could see how that plume is traveling across the city and what areas will be affected in the short term.
The (New York City) Department of Buildings or Office of Long-Term Planning and Sustainability would probably be interested in this kind of work. As the project advances in the future, as we develop this methodology, the impact becomes very clear.
CPE: What are you tracking, exactly?
Dobler: The types of things we measure are pollution plumes, key changes in buildings, activity in buildings, aggregate patterns of light activity as a core for total energy consumption.
CPE: Do you think this type of data analysis will gain a following and other cities will follow suit?
Dobler: If I had to look into my crystal ball, yes. We’re getting interest as we find out a lot more cool stuff. We’re making headway toward driving solutions to problems that didn’t have a solution before. We have gotten interest from the public and private sectors.
Also, the cost is now going down quite a bit. It is not prohibitive, even for a city with relatively (limited) budget and resources. Computational abilities and analysis techniques for a lot of these imaging tasks are really coming into their own these days, so there’s a tremendous amount that can be learned from imaging of not just cities but everything. When (they) see the benefit to New York City, other cities will see what’s possible, and will want to jump on board.


You must be logged in to post a comment.