

DC Sales Rank High, Prices Drop
See how the market ranks nationally for office investment volume, vacancy and other key metrics, according to Yardi Matrix data.
Washington, D.C.’s office sector continued to show strong figures in terms of investment volume, according to the latest Yardi Matrix data. The District ranked third nationally for total sales volume in the first nine months of the year, despite assets trading for less than the national average.
Construction activity remained sluggish, the capital’s pipeline being one of the smallest among gateway markets, with only Chicago faring worse. Completions also dropped to almost a third year-over-year.
The city also extended the Housing in Downtown program—which grants a 20-year tax abatement for commercial-to-residential conversions—to include the Near Northwest Planning Area. So far, eight projects benefited from the project, which would generate 1,745 units.
D.C. sales stay near the top
Washington, D.C.’s office investment volume year-to-date as of September clocked in at $3.2 billion. The metro ranked third nationally, surpassed only by Manhattan ($5.5 billion) and the Bay Area ($4.3 billion). Seattle ($506 million) and Miami ($411 million) were at the opposite pole.
Assets in The District traded for $182 per square foot on average, slightly below the $195 national average. Manhattan posted the highest prices nationally, at $530 per square foot. Chicago assets traded at $61 per square foot, the lowest price among gateway markets.
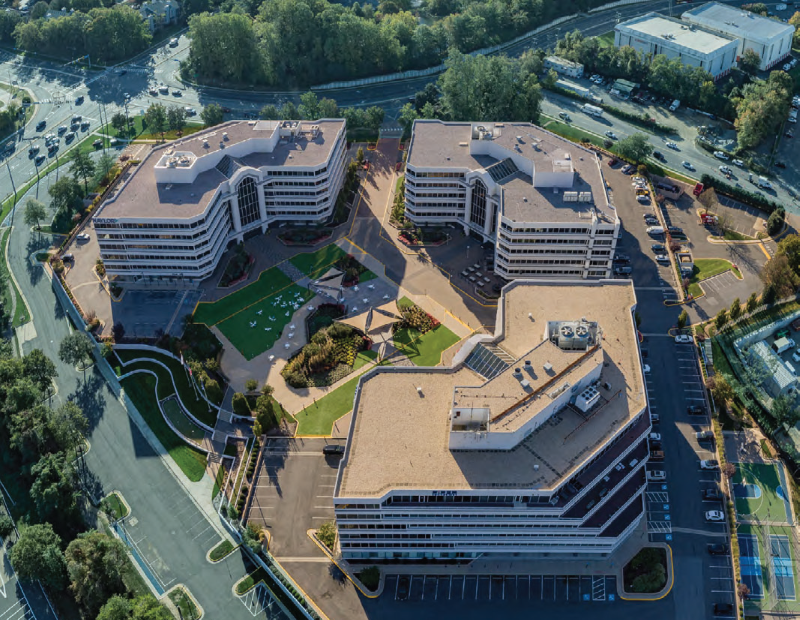
JBG Smith acquired Tysons Dulles Plaza, a three-building office campus in Tysons, Va., totaling 500,000 square feet. The buyer plans to re-entitle and redevelop one of the mid-rises into residential use, while the other two will be renovated and modernized.
The District’s pipeline thins out
Washington, D.C.’s office development pipeline as of the same month was 687,967 square feet, Chicago (505,983 square feet) being the only other gateway market to lag behind. This figure accounted for 0.2 percent of its total office inventory, a third of the national average.
Miami (2.2 percent) had the largest share among similar metros. When also taking into account projects in planning stages, The District’s figure reached 1.2 percent, still below the national average and most of its peers.

A joint venture between Rockefeller Group and Stonebridge is working on 600 Fifth, a 400,000-square-foot redevelopment in D.C. The project represented the repositioning of the former Metro headquarters and will see the addition of three stories. Completion is scheduled for next year.
The metro saw only four office properties coming online year-to-date as of September, totaling 734,538 square feet. This accounted for 0.2 percent of its stock, only 10 basis points below the national average.
One of the properties that came online this year is Comstock Cos.’ Reston Station, a 262,674-square-foot building in Reston, Va. The building rises nine stories and was built according to LEED Silver standards.
Listing rates dip as vacancy rises
Washington, D.C.’s office vacancy rate at the end of September clocked in at 20 percent, marking a 230-basis-point increase year-over-year. This figure was also above the 18.6 percent national index.
Among gateway markets, Seattle (27 percent) and San Francisco (26.7 percent) posted the highest rates, while Manhattan (12.8 percent) and Miami (12.8 percent) had less available space.
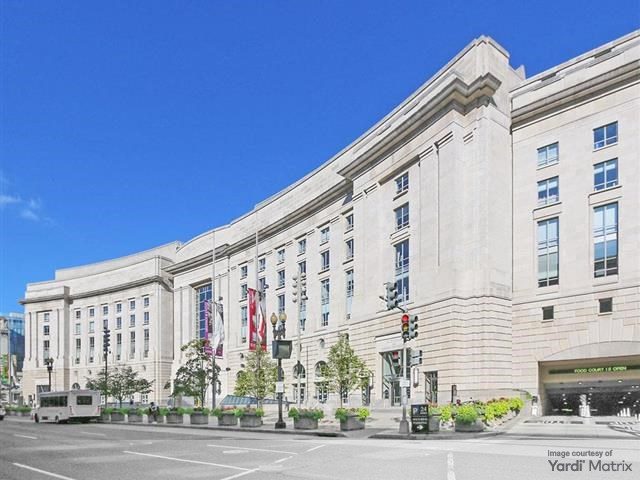
In the third quarter of this year, The Federal Bureau of Investigation announced its headquarters will remain in Washington, D.C. The agency will relocate to the 3.1 million-square-foot Ronald Reagan Building and International Trade Center, moving from a 1.7 million-square-foot property.
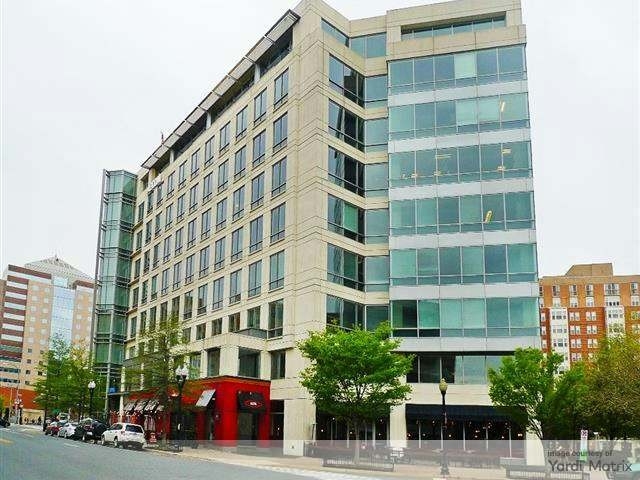
Additionally, international law firm Milbank LLP moved to more than 64,000 square feet at a 12-story building within Washington, D.C.’s East End submarket. Oxford Properties and Norges Bank Investment Management own the 2006-completed building.
In terms of listing rates, The District registered a 1.6 percent year-over-year decrease, dropping to $40.8. Manhattan ($66.3) and San Francisco ($64.2) lead nationally.
D.C. flex footprint lags peers
Washington, D.C.’s coworking inventory at the end of September reached 7.1 million square feet across 300 locations, according to CoworkingCafe. This mirrors national coworking industry trends that show demand shifting toward flexible space models.
The market’s figures accounted for 1.8 percent of its total office stock, 30 basis points below the national average. The District’s share was also below all gateway metros. Miami (4.1 percent) ranked first in the U.S., followed by Chicago (2.6 percent) and Manhattan (2.4 percent).
In July, Carr Workplaces opened a coworking location in Arlington, Va. Spanning 26,331 square feet, the space is within Comstock Cos.’ Hartford Building, a 211,450-square-foot property. The flex office provider with the largest coworking footprint in The District was Regus, with 668,227 square feet across 31 locations. The company was closely followed by Navigate (584,976 square feet) and WeWork (557,171 square feet). Industrious (476,332 square feet) and Spaces (425,562 square feet) rounded up the top five.


You must be logged in to post a comment.