

Return-to-Office Numbers Hold Strong
Despite a seasonal dip in attendance, last month was the busiest in-office December since the pandemic.
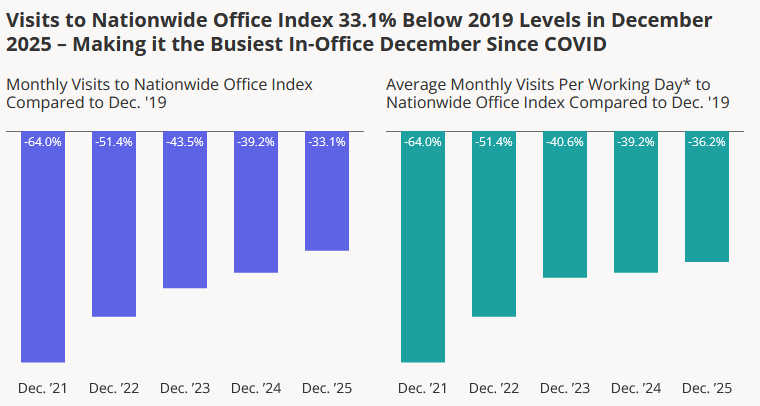
Office properties scored their busiest December since the pandemic, according to the latest Placer.ai Office Index. The trend toward return-to-office is still gaining momentum, albeit slowly but surely.
Office foot traffic was down 33.1 percent in December 2025 compared with the same month in 2019. In December 2024, traffic was down 39.2 percent compared with the same month in 2019, Placer.ai reported. In December 2021, traffic was down 64 percent.
For the past few years, return-to-office trends have followed a predictable pattern, with mandates for increased attendance frequently announced for September (following summer holidays) or January (after the winter break), Caroline Wu, director of research at Placer.ai, told Commercial Property Executive.
“This year is no exception. While office attendance typically dips in November and December due to the holidays, workers are returning in force this January,” she said.
Long-term RTO trends
Seasonal variations aside, the trend has been for more workers in more places to spend more time in the office. That metric has been slowly creeping up as employers put more emphasis on RTO, rolling out more carrots and sticks to get workers to go along.
In a report released last summer, 87 percent of organizations surveyed by CBRE said that current office attendance realities are creating challenges for management, who are keen to meet those challenges.
For example, more than half of organizations reported that non-peak attendance days resulted in a “lack of office vibrancy.”
READ ALSO: A Newmark Executive on the Office Lease Renewal Cycle
Other common challenges for management posed by lagging RTO include accurately anticipating future space needs and providing the right type of space, CBRE found. Uneven attendance patterns create peaks and troughs throughout the week that create an inconsistent experience for employees, according to management.
With the pressure on to bring back employees, the trend of increasing office visits isn’t going to reverse itself next year, Wu told CPE.
“Many companies that previously accepted two to three days in the office are now raising requirements to four or even five days a week, while others are strictly enforcing onsite hour minimums,” Wu said.
“As workers head into 2026, the proportion of time spent in the office is expected to rise,” she added.
Miami leads, San Francisco has spring in its step
More workers have returned to office in Miami than any of the other cities Placer.ai tracks. Foot traffic in that city was down 10.9 percent this December compared with the same month in 2019. Miami has long been a leading market in RTO.
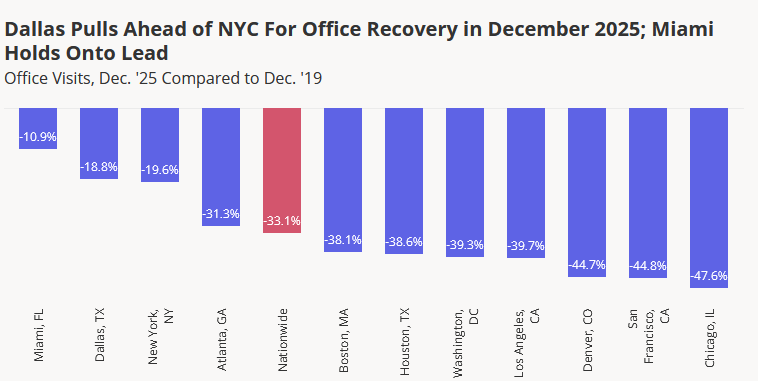
Dallas followed closely behind at 18.8 percent down in the same month-to-month comparison. But high rates of office visits aren’t exclusively the province of Sun Belt cities. Close behind Dallas is New York City, which was 19.6 percent down compared with 2019.
Chicago, meanwhile, lagged at 47.6 percent down, the highest of any of the cities. Other markets with tepid visit rates include San Francisco (down 44.8 percent) and Denver (down 44.7 percent).
READ ALSO: 2026 Office Outlook
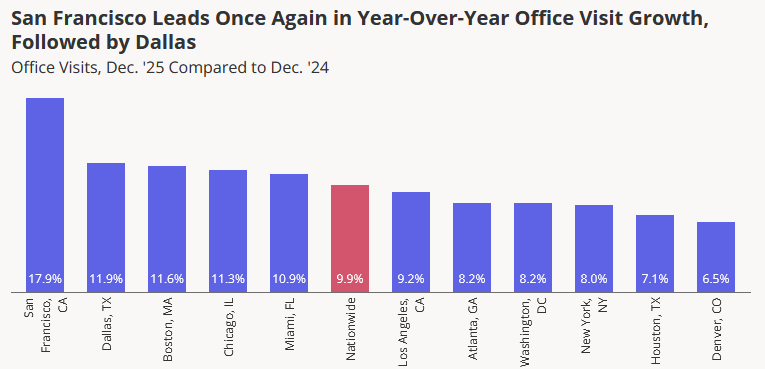
While San Francisco is still the second-slowest to see workers return to office, the city is nevertheless leading the office visit recovery, the report found. Visits in that market were up almost 18 percent year-over-year in December. Dallas, Boston and Chicago all saw annual increases of more than 11 percent in December, coming in the highest after San Francisco.
The Placer.ai Office Index tracks office visits in 11 major U.S. office markets: Miami, New York City, Atlanta, Dallas, Washington D.C., Houston, Boston, Los Angeles, Chicago, Denver and San Francisco. It analyzes data from some 1,300 office buildings, including newer ones that were at least partially leased from the end of 2019, but doesn’t include government-occupied buildings or mixed-use properties.
You must be logged in to post a comment.