

Office Report: Demand Shifts as Coworking Gains Momentum
The coworking sector expanded significantly as a response to remote work options, among other changes in the market.
The coworking sector continued to expand in response to hybrid work trends, offering companies flexible, cost-effective alternatives to long-term leases, according to the latest Yardi Matrix national office report.
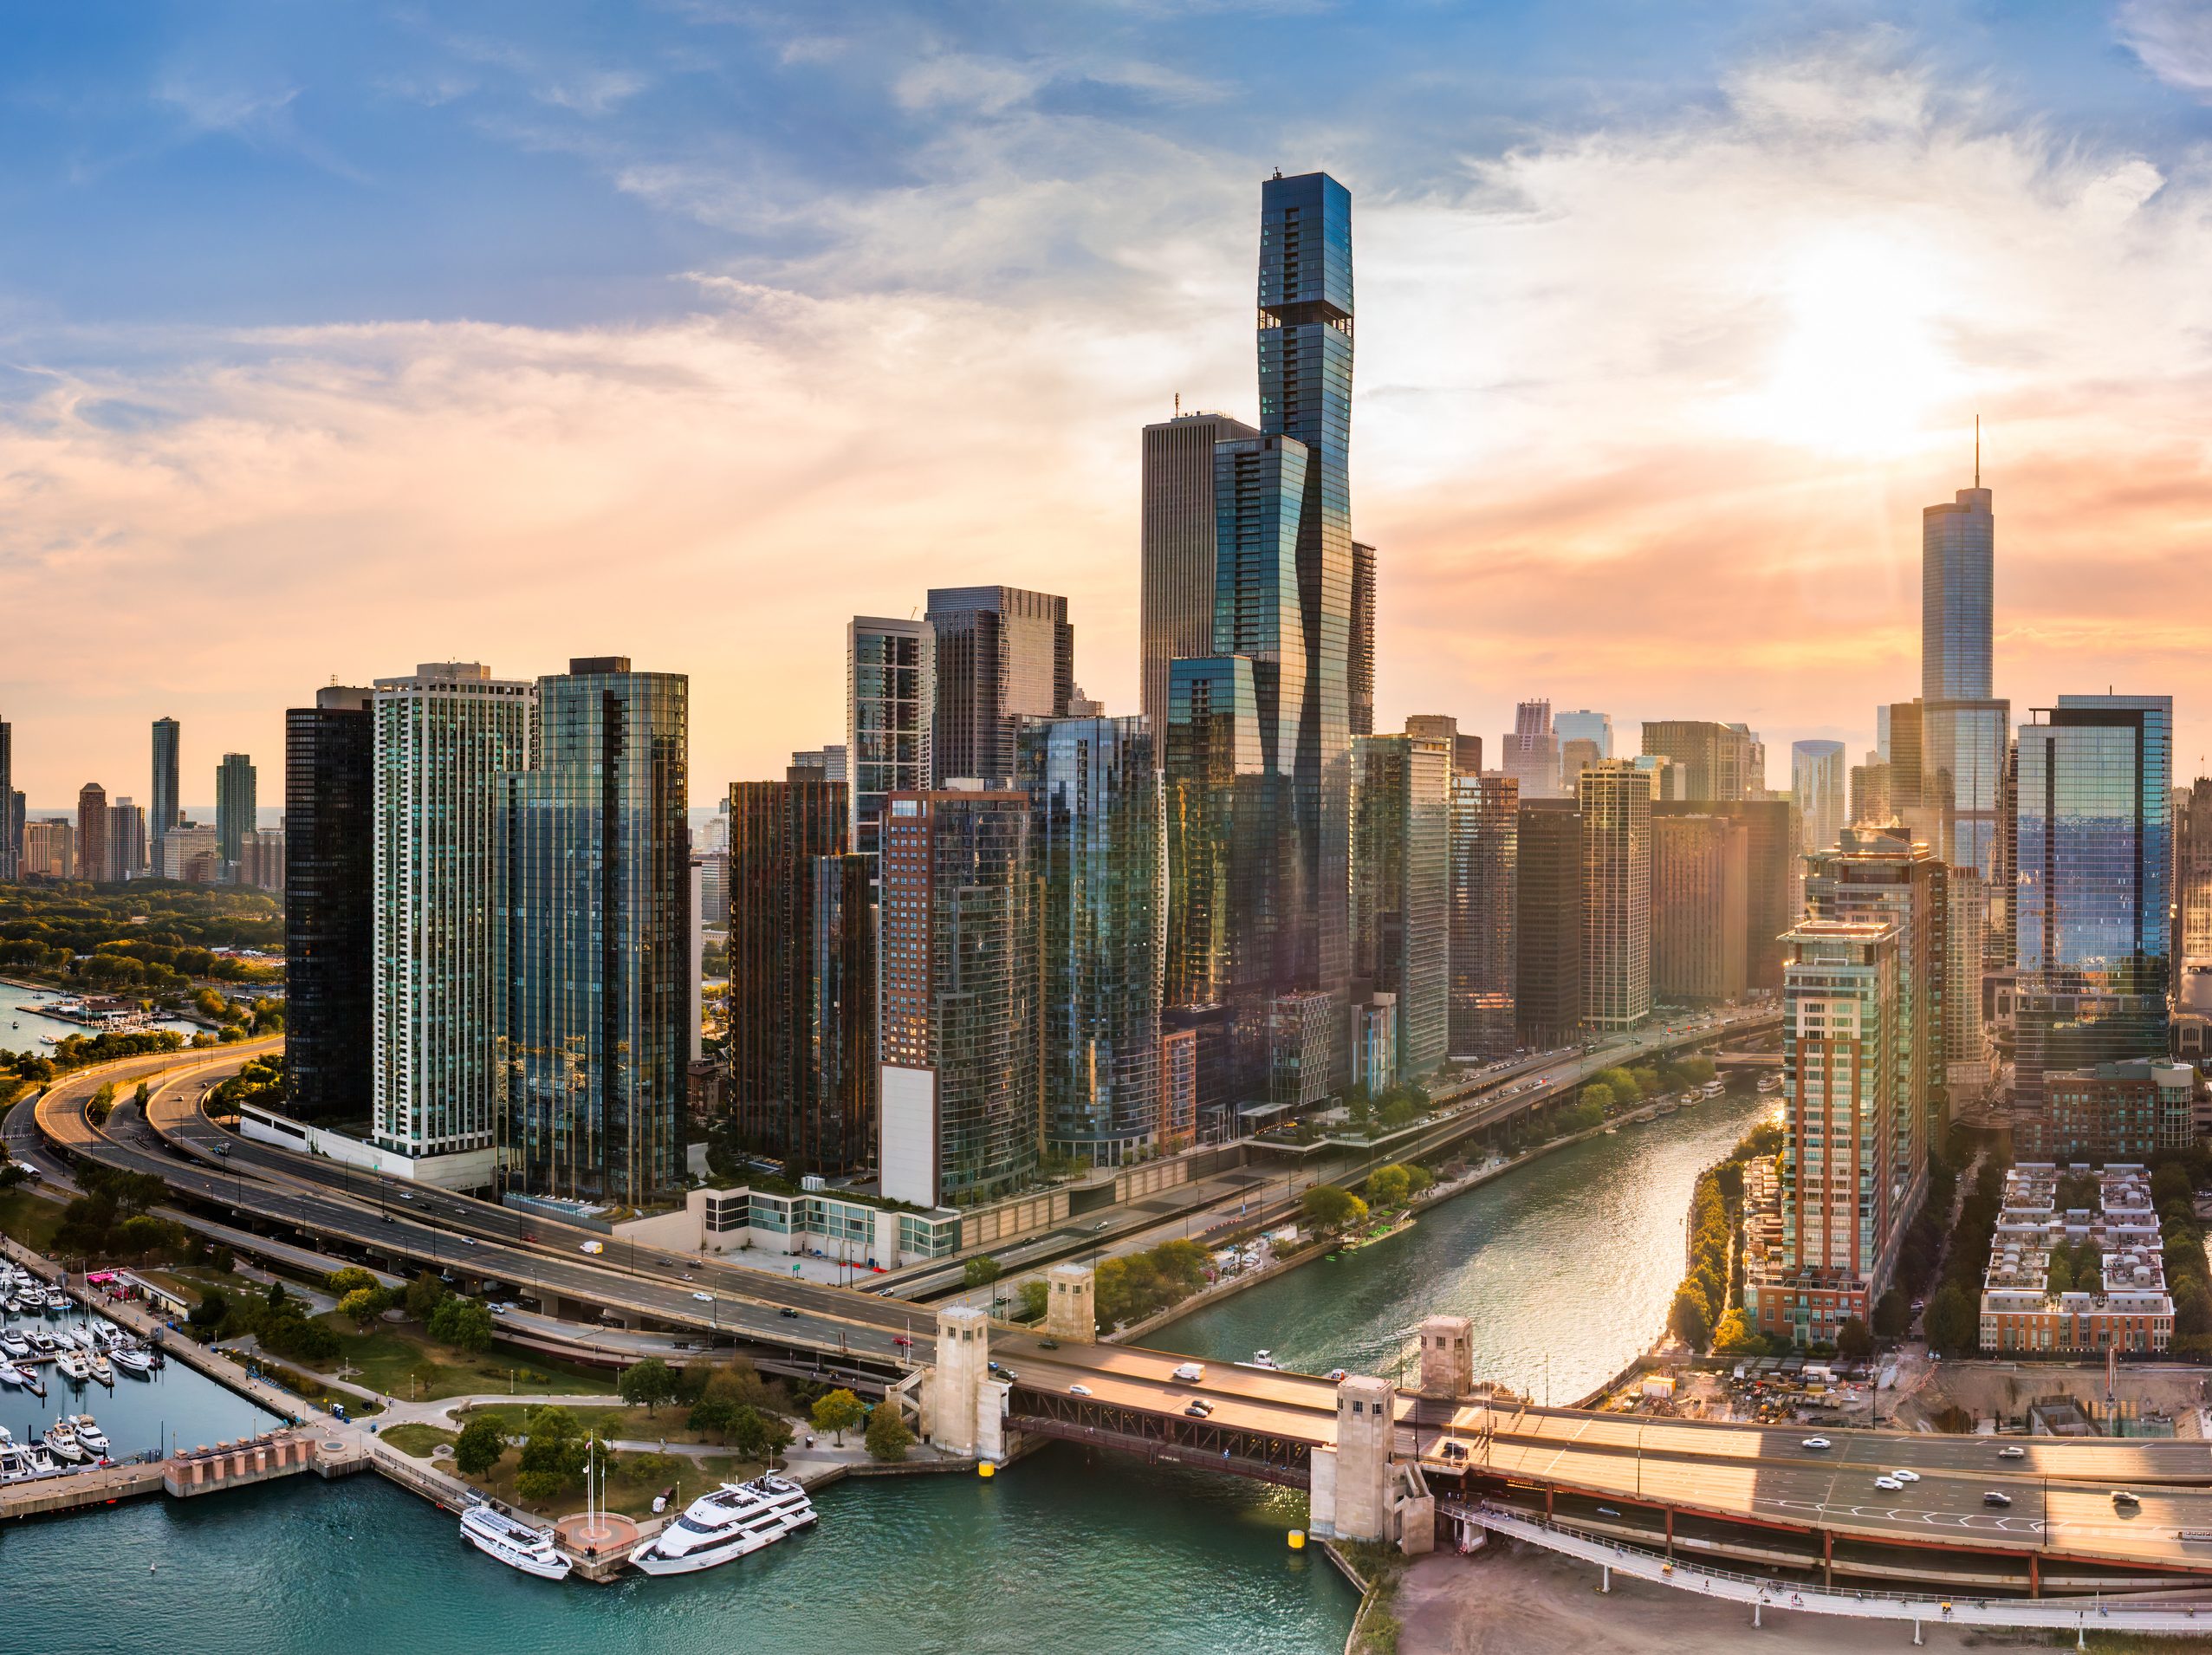
Nationally, flex space accounted for 2.1 percent of total office inventory, up 20 basis points year-over-year. Among the top 25 markets, Chicago saw the largest increase—up 60 basis points to 2.6 percent—followed by Atlanta, San Diego, Orlando, and Miami.
As of September, the U.S. had 8,420 coworking spaces, an 11.7 percent annual increase, totaling 152.2 million square feet—14 percent higher year-over-year. The sector’s footprint grew faster than its location count, raising the average coworking space size by 2.1 percent to 18,080 square feet.
Major operators such as Regus, HQ, Vast Coworking, Industrious, Spaces, and WeWork expanded their combined market share by 150 basis points over the past year, with Regus adding the most new spaces. Smaller players are also consolidating, such as the merger between Creative Density and Thrive Workplace Denver, while WeWork’s affiliate network added over 1,000 partner sites, signaling continued expansion through both growth and partnerships.
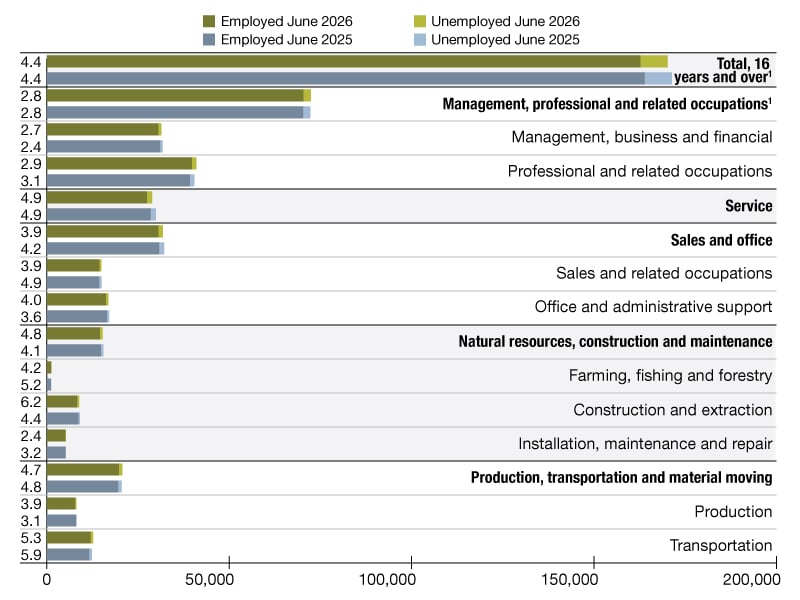
Office-using sectors lost 19,000 jobs in September, according to ADP, led by declines in professional and business services, which shed 13,000 positions. Despite the monthly contraction, office-using employment rose 0.7 percent year-over-year, adding 254,000 jobs nationwide.
READ ALSO: WiRE Special Report: Office Remains Resilient in Major Markets
The national office vacancy rate stood at 18.6 percent in September, down 80 basis points year-over-year. Austin and Seattle remained the metros with the highest vacancy rates, both at 27 percent, followed by San Francisco (26.7 percent), Detroit (23.8 percent), the Bay Area (23.8 percent), and Denver (23.5 percent).
Nashville posted the largest annual increase among the top 25 markets, with its vacancy rate climbing 220 basis points to 19.5 percent. A supply surge—8.7 million square feet delivered since 2020—combined with the ongoing impact of hybrid work contributed to the rise. However, construction activity has slowed sharply, with only 300,000 square feet currently underway, which may help future absorption.
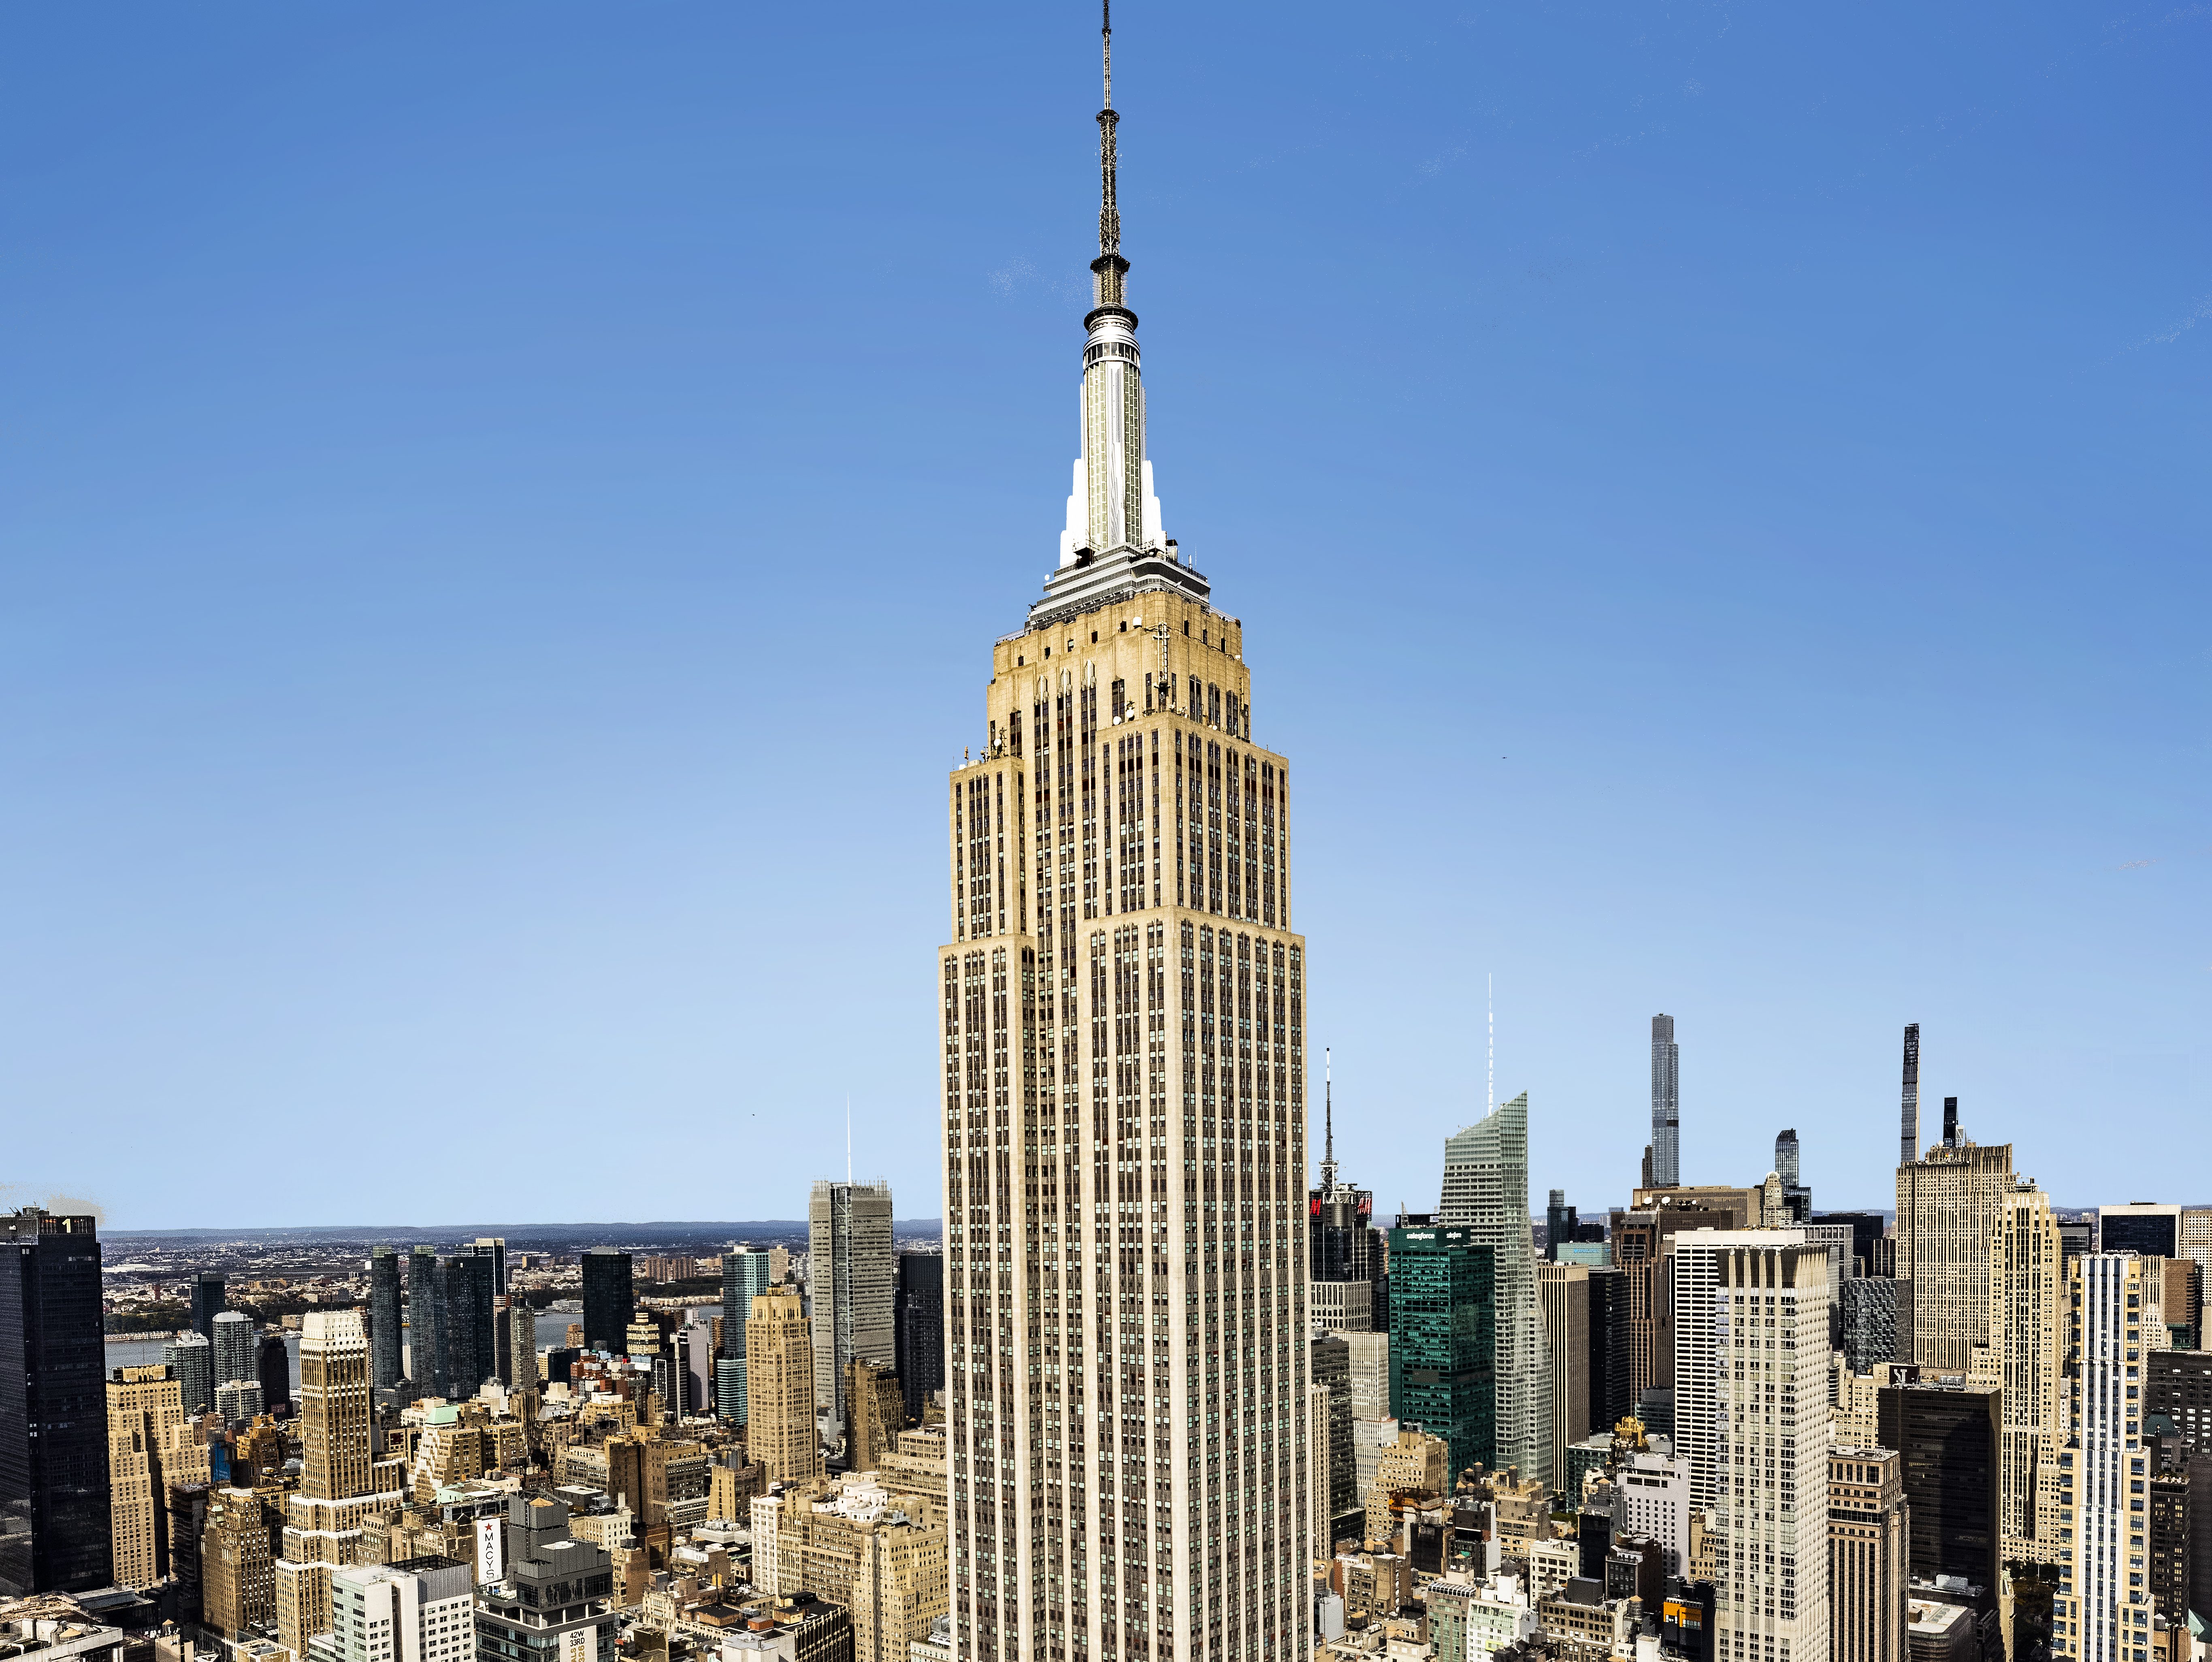
The average full-service equivalent listing rate was $32.79 per square foot in September, up $0.16 month-over-month but 0.3 percent lower year-over-year. Markets posting the strongest rent growth included Atlanta and Portland, while Houston saw the steepest decline. Manhattan remained the priciest market at $66.27 per square foot, followed by San Francisco ($64.17 per square foot) and Miami ($56.45 per square foot).
Office demand softens, developers pull back
Nationwide, 38.5 million square feet of office space was under construction in September, accounting for 0.6 percent of existing stock and 1.8 percent when including projects in planning or proposal stages.
Year-to-date, 19.1 million square feet have been completed, with expectations for further declines in delivery volume ahead. Construction starts totaled 11.9 million square feet, mirroring last year’s subdued pace, as demand for new office space continues to weaken.
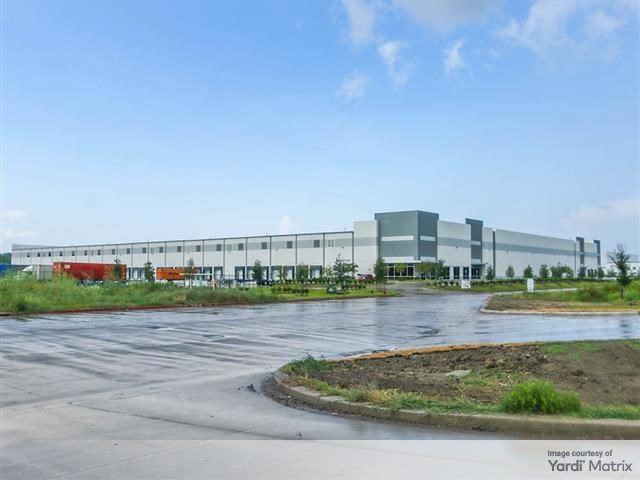
Boston remained the leading development market, with nearly 4.5 million square feet underway, followed by Manhattan (3 million square feet) and Dallas (2.6 million square feet). In Texas, developers broke ground on The Van Zandt, a mixed-use Class AA project in Fort Worth that will include 100,000 square feet of office space, pushing the Dallas pipeline past the 1 million-square-foot mark and signaling continued demand for high-end office product.
As of September, the U.S. office sales volume totaled $38 billion, with assets trading at an average of $195 per square foot across just under 2,000 transactions—the highest sales volume recorded since 2022.
Manhattan led all markets in both pricing and total volume, with offices trading at $530 per square foot and $5.5 billion in closed deals. Other high-priced markets included the Bay Area ($392 per square foot) and San Diego ($304 per square foot).
Read the full Yardi Matrix office report.
You must be logged in to post a comment.