

Where Office Visits Are Spiking Now
The latest return-to-office update shows how seasonal factors came into play.
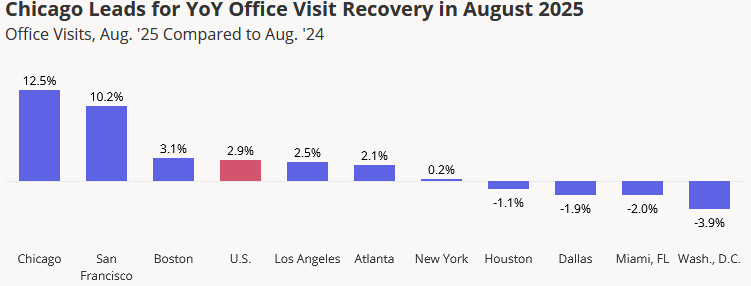
Chicago and San Francisco enjoyed significant increases in office visits by tenants since August of last year, besting every other major U.S. metro tracked by Placer.ai by that metric. Chicago experienced a 12.1 percent increase year-over-year, while San Francisco turned in a 10.2 percent increase.
The average annual increase in visits among the 10 cities forming the Placer.ai Nationwide Office Building Index was 2.9 percent. The only other city better than that average was Boston, which eked out a 3.1 percent increase, just above the index average.
The seven remaining cities—Miami, New York, Atlanta, Dallas, Houston, Los Angeles and Washington, D.C.—each turned in weaker visit growth than average.
The short-term robustness of Chicago and San Francisco shows recent momentum in office visits for the two cities. In Chicago, the report called the increase “encouraging progress for the Windy City, though it remains to be seen whether this signals the beginning of a lasting turnaround.”
In San Francisco, Placer.ai chalked the increase up to a faster pace of hiring and locating AI specialists in the city.
Calendar differences, seasonal vacation patterns
The 10-city average for August 2025 office visits dropped 34.3 percent compared to August 2019—representing a modest retreat compared with other months this year. The drop was likely driven by calendar differences and seasonal vacation patterns, Placer.ai reported.
Leaders in this metric are Miami and New York City, which are down 15.7 percent and 16 percent, respectively, in August 2025 compared with August 2019. That represents a weaker pace of visits compared with earlier months of this year, when New York City especially was on par with its own 2019 visitation rates, which the report posits is due to one-time factors, such as the fact that August 2025 had fewer business days than August 2019.
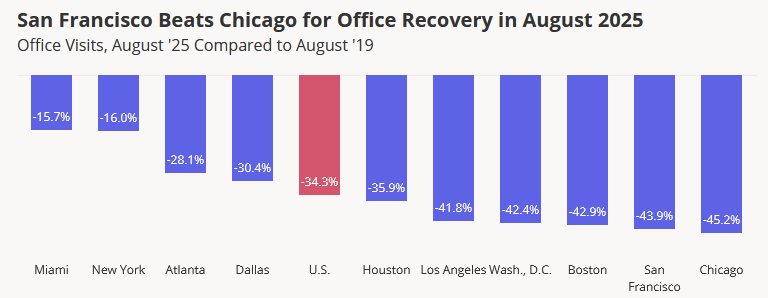
As for Chicago and San Francisco, they are still basement dwellers in this metric, at 45.2 percent and 43.9 percent lower than in 2019, respectively. In some ways, the two cities’ recent improvements are a function of the fact that the pandemic hit them hard in terms of office visits, and so they have a long way to go to improve compared with 2019.
READ ALSO: Discounted Office Sales Multiply, Pressures Persist
Nationwide, office visits in August—compared to the pre-pandemic year 2019—are down in the range of 30 percent to 40 percent for the last three full years (2022, ’23 and ’24) running, according to Placer.ai data. That points to some stability in the office market, even hinting at fuller recovery ahead.
The slow climb back toward 2019 office visit totals is partly due to the recent stiffening of return-to-office mandates. Three days per week is the most common mandate among companies with required in-office presence, followed by five days, according to a 2025 report by Savills. New York and Miami are two markets leading the return-to-office mandates.
The Savills report analyzed the return-to-office policies of the top 200 Fortune 500 companies.
Placer.ai’s index analyzes foot traffic data from about 1,000 office buildings nationwide, including only purely office buildings and office buildings with ground-floor retail. The pool of buildings is also relatively new, including those that were at least partially leased by the end of 2019.
Offices leased by various levels of government aren’t part of the sample, and neither are mixed-use properties that have similar-sized office and residential components.


You must be logged in to post a comment.