


2020 Net Lease Office Sales Volume and Cap Rates
Single-tenant office sales volume versus average cap rates, updated quarterly.
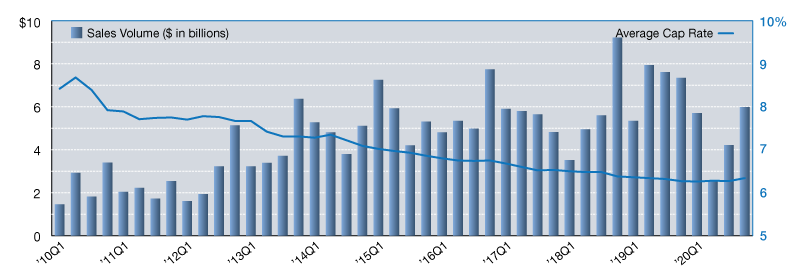
Source: Stan Johnson Co. Research, Real Capital Analytics
The single-tenant net lease office sector had a challenging year in 2020. It started the year off strong, as did the entire industry, riding the momentum wave from 2019. But activity screeched to a halt in March when the pandemic began, and investors hit the pause button.
After a lackluster second quarter, the office market rebounded, posting two consecutive quarters of growing sales totals in the second half of the year. In fact, fourth quarter demand even outpaced first quarter.
Sluggish activity at mid-year, however, wasn’t enough to buoy annual totals. The office market reported just shy of $18.5 billion on the year, with roughly one-third of that demand logged in the final quarter. For cap rates, it’s likely that we’ve seen averages bottom out for the office sector.
After several quarters of negligible movement in late 2019 and during most of 2020, rates have inched upward and finished the year eight basis points off the low at 6.3 percent. International buyer activity was cut in half year-over-year, as this group represented only 12 percent of office transactions in 2020.
This allowed U.S.-based institutional investors to gain dominant market share over private investors for the first time since 2016. These two groups represented 35 and 30 percent of the sector, respectively, and are likely to drive office activity in 2021.
Focusing on business development, industry and client-specific research, and the analysis of local and national market trends, Lanie Beck has been the Director of Research for Stan Johnson Co. since 2013.
—Posted on Apr. 26, 2021

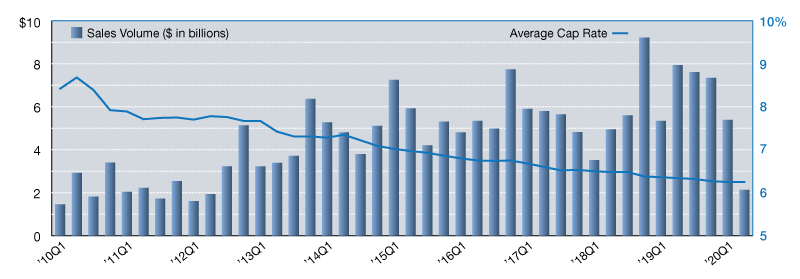
Source: Stan Johnson Co. Research, Real Capital Analytics
The single-tenant net lease office sector saw increased investment sales activity during third quarter 2020, but activity levels remain stunted compared to recent years. Over the last three months, the office market recorded $3.6 billion in sales volume, which was up from second quarter’s $2.3 billion. Even with the reasonably strong start to the year, the sector is only on pace to reach about $15.4 billion in 2020, which would make it the slowest year since 2012. Despite an overall reduction in market activity, there continue to be bright spots. Within the overall office market, the net lease subset continues to be more attractive to investors. Strong credit tenants paired with long-term leases and a passive ownership structure help lower investment risk in a time where the future of office usage is being questioned. Additionally, an uptick in sale-leaseback activity may help drive sales volume across the sector. Expect to see continued activity in fourth quarter and into 2021, even if sales volume is reduced compared to recent boom years.
Focusing on business development, industry and client-specific research, and the analysis of local and national market trends, Lanie Beck has been the Director of Research for Stan Johnson Co. since 2013.
—Posted on Jan. 25, 2021
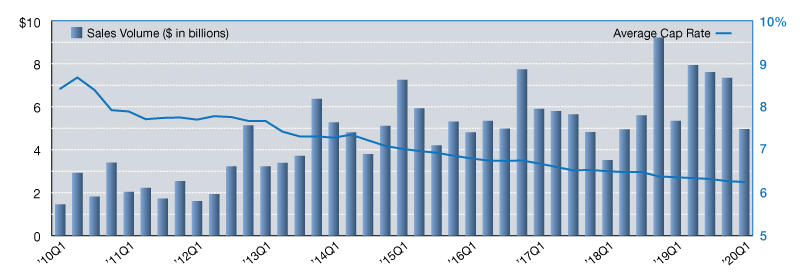
Source: Stan Johnson Co. Research, Real Capital Analytics
The single-tenant net lease office market reported a tremendous amount of activity in 2019, shattering records to report more than $28.3 billion in transactions. But momentum hasn’t been sustainable due to COVID-19’s impact on the investment market. The net lease office sector has struggled in the last three months, posting the lowest quarterly sales totals since mid-year 2012. The sector’s first half totals, however, have been buoyed by a fairly strong first quarter, and more than $7.5 billion in sales have been reported year-to-date. This activity isn’t strong enough to compete with investment sales levels in recent years though, and the market is currently not even on pace to meet 2013 annual totals. Quarter-to-quarter, average cap rates for single-tenant net lease office product remained flat at 6.26 percent. Averages have been trending very slowly downward, and current levels have only adjusted 10 basis points in the last 15 months. The recent lack of movement may indicate that rates are at or near the bottom, but we’ll be watching the trend line closely in the coming quarters as the sector continues to be impacted by COVID-19.
Focusing on business development, industry and client-specific research, and the analysis of local and national market trends, Lanie Beck has been the Director of Research for Stan Johnson Co. since 2013.
—Posted on Oct. 26, 2020
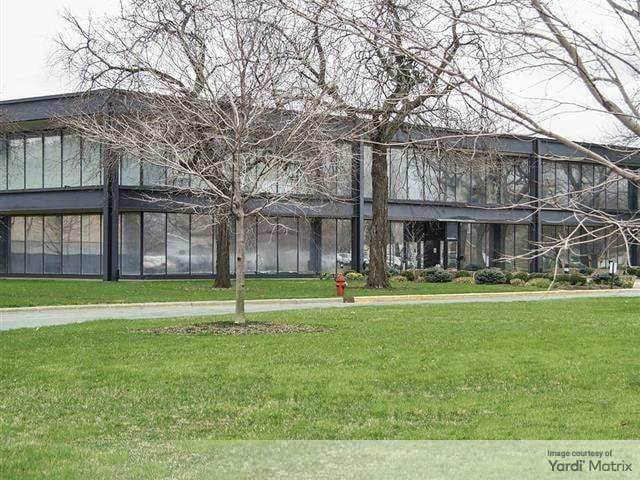
Source: Stan Johnson Co. Research, Real Capital Analytics
Single-tenant office investments have been growing in popularity with net lease buyers in recent years, with annual investment sales activity exceeding $28.2 billion in 2019, which significantly outpaced the record set previously. Leading up to this banner year, the office market has had an incredibly strong showing, with nearly $120.0 billion in sales reported from 2015 to 2019, representing more than one-third of the total market’s activity during this time. Despite this positive momentum, we witnessed a drop-off in activity during early 2020 amid the health crisis. As investors pulled back and adopted a wait-and-see attitude, the net lease office market reported only $5.0 billion in sales during Q1 2020, which was the sector’s slowest quarter in 21 months. Average cap rates continued to compress, ending the quarter at 6.3 percent. As the trendline begins to flatten, dropping only two basis points since year-end, it is likely that we will see office cap rates officially bottom out sometime in 2020, although the impact from COVID-19 is still yet to be fully realized.
Focusing on business development, industry and client-specific research, and the analysis of local and national market trends, Lanie Beck has been the Director of Research for Stan Johnson Co. since 2013.
—Posted on Jul. 22, 2020


You must be logged in to post a comment.