2019 Net Lease Retail Sales Volume & Cap Rates
Single-tenant retail sales volume versus average cap rates, updated quarterly.
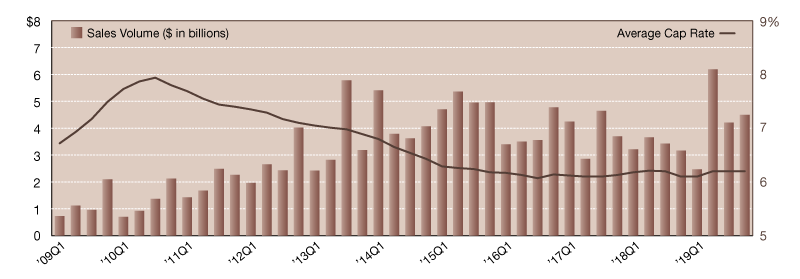
Source: Stan Johnson Co. Research, Real Capital Analytics
Record setting levels of investment sales activity seen at mid-year for the single-tenant net lease retail sector helped push the sector to more than $17.6 billion in 2019—marking its second strongest year of activity in history. This is a far cry from where we started the year, as a paltry $2.8 billion reported during first quarter 2019 indicated that further slowing might be expected for retail.
However, investors weren’t on the sidelines for long, as nearly $6.2 billion in investment sales were recorded during second quarter. Back-to-back quarters of better-than-average sales volume ended the year, and the net lease retail sector is well positioned to see that momentum carry over to the first half of the next decade. Cap rates, on the other hand, haven’t seen much movement at all in the past year. Up only five basis points from year-end 2018, the sector ended 2019 at 6.2 percent. With cap rates essentially flat since 2015, will we see significant upward movement in 2020? Probably not, although further compression in this sector is unlikely too.
Focusing on business development, industry- and client-specific research, and the analysis of local and national market trends, Lanie Beck has led Stan Johnson Co.’s research department since 2013 and has overseen corporate communications since 2018.
—Posted on Feb. 21, 2020
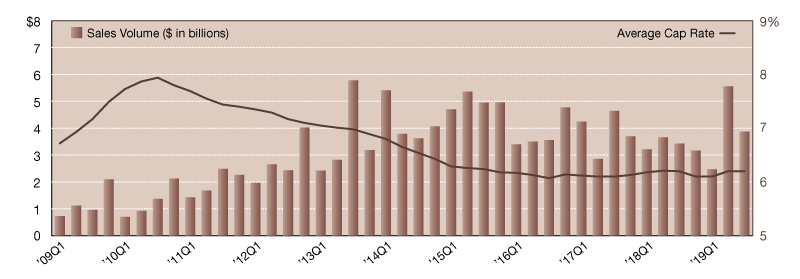
Source: Stan Johnson Co. Research, Real Capital Analytics
Predictions early in the year pointed to a single-tenant net lease retail sector that would likely fall short of matching demand year-to-year. However, second quarter 2019’s near-record sales total of $5.6 billion was followed by another stronger-than-average quarter, pushing the market’s year-to-date transaction volume to $12.3 billion. After only nine months, the Mid-Atlantic and Southwest regions have already exceeded 2018 annual sales totals, and it looks like the overall single-tenant retail market will too by year-end. Unless there’s a significant drop off in activity during the last three months of the year, which is not anticipated, the sector is expected to post somewhere between $15.0 and $16.5 billion on the year. Cap rates have essentially been flat since early 2015, and there’s no indication that we’ll see substantial changes before year-end. While rates are expected to rise, and we’re already seeing some upticks in certain subsectors, it may take several more quarters to see increases of more than just a few basis points per reporting period.
Focusing on business development, industry- and client-specific research, and the analysis of local and national market trends, Lanie Beck has led Stan Johnson Co.’s research department since 2013 and has overseen corporate communications since 2018.
—Posted on Nov. 18, 2019
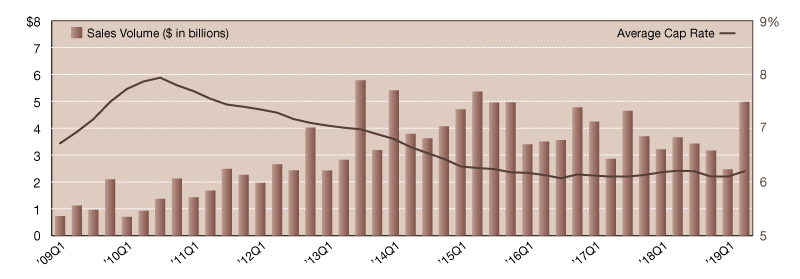
Source: Stan Johnson Co. Research, Real Capital Analytics
After a slow start to the year, second quarter 2019 posted more encouraging sales figures across all single-tenant net lease property sectors, bringing year-to-date totals to $29.6 billion. We are now roughly 4 percent ahead of where we were this time last year—and 2018 ended up reporting just shy of $70.0 billion in sales. Is a repeat of last year expected? Likely no, but market conditions continue to be excellent for investors, especially with the Fed’s decision to lower interest rates. The single-tenant retail sector was particularly strong in second quarter, posting its highest gains since mid-2015 at nearly $5.0 billion in sales. Coming off one of the sector’s slowest quarters, this is great news for investors fearing the “retail apocalypse.” Instead of seeing back-to-back quarters of sluggish activity, the retail sector reported very robust sales totals indicating that industry fundamentals are healthy, particularly for internet-resistant tenants like quick service restaurants, convenience stores, and experiential retail. Average cap rates across the sector witnessed a five-basis-point uptick in the last three months, ending mid-year at 6.2 percent. Despite the increase, rates have been incredibly steady for the last few years and are currently on par with levels seen in early 2016 and again in early 2018.
Focusing on business development, industry and client-specific research, and the analysis of local and national market trends, Lanie Beck has been the Director of Research for Stan Johnson Co. since 2013.
—Posted on Aug. 22, 2019
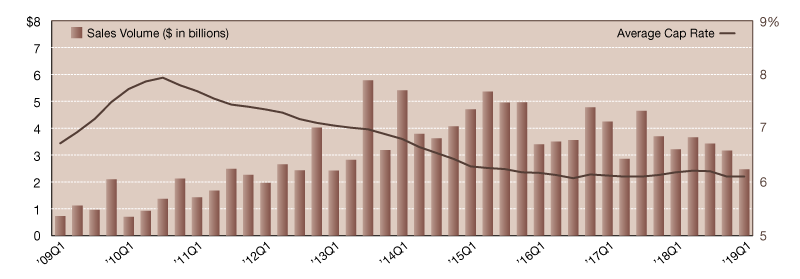
Source: Stan Johnson Co. Research, Real Capital Analytics
A lower-than-average first quarter 2019 has the single-tenant net lease retail market tracking toward its slowest year since 2011. With only $2.5 billion in sales reported to start the year, the retail sector has a lot of ground to make up if it expects to rival last year’s sluggish totals that didn’t quite reach $14.0 billion. Cap rates declined yet again, falling to 6.1 percent, but with only a one-basis-point drop, the market shouldn’t expect further compression. A significant number of new listings came online early this year, and buyers will need some to time to sort through the new inventory. This can result not only in lower sales totals, but it can impact cap rates too. When premium properties are the only ones trading in a shifting market, sold cap rate averages may not yet reflect the increases we’re seeing in current asking cap rates. While future cap rate increases are expected, it may take some time to see a noticeable uptick. Interest rates remain low and economic conditions are superb for investors. Even though we may be at or past the peak of this real estate cycle, there’s still a lot of energy left in the marketplace which could translate to more robust activity later in the year.
Focusing on business development, industry and client-specific research, and the analysis of local and national market trends, Lanie Beck has been the Director of Research for Stan Johnson Co. since 2013.
—Posted on May 20, 2019


You must be logged in to post a comment.