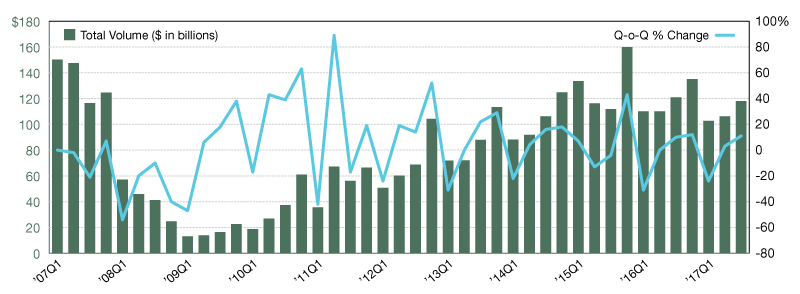
2017 Transaction Volume
Commercial real estate volume and percent change based on properties and portfolios of $2.5 million and greater, updated quarterly.

Source: Real Capital Analytics Inc., www.rcanalytics.com
Transaction volume for all major property types reached $124.4 billion in the fourth quarter of 2017, up by 5.0 percent compared to the third quarter of 2017 ($118.5 billion), and up by 16.2 percent compared to the second quarter of the year ($107 billion), pointing toward an increasing tendency for investment. On a year-over-year basis, total transaction volume decreased by 8.3 percent, compared to the same period in 2016. Quarter-over-quarter, transaction volume for Office CBD properties increased by 71.0 percent, followed by a moderate 15.0 percent growth for Garden apartments, and only 1.0 percent for Mid- and High-rise apartments. Transaction volume for Flex & Warehouse assets decreased by 22.0 percent in the fourth quarter of 2017, compared to the previous quarter.
—Posted on April 18, 2018
Source: Real Capital Analytics Inc., www.rcanalytics.com
The transaction volume for all major property types totaled $118.1 billion in the third quarter of 2017, up by 11.2 percent compared to the second quarter of 2017 ($106.1 billion) and by 15.0 percent compared to the first quarter of the year ($102.6 billion). On a year-over-year basis, total transaction volume decreased by 2.3 percent compared to the same period in 2016. Quarter-over-quarter, transaction volume for Flex & Warehouse properties increased by 56.0 percent, followed by a 38.0 percent rise for Mid- and High-rise apartments and 8 percent for Garden apartments. Transaction volume for CBD Office assets decreased by 31.0 percent in the third quarter of 2017 over the previous quarter.
—Posted on Jan. 30, 2018
You must be logged in to post a comment.