

2016 Top Owners
CPE and MHN reveals this year's top commercial and multifamily owners.
By Chris Nebenzahl, Associate Director of Research, Yardi Matrix
You can also read our 2017 Top Owners and 2015 Top Owners rankings.
Property Counts
 Property values continue to be exceedingly high and cap rates remain at historic lows across the industry, and as a result, the transaction market has been very busy over the past few years. Of the respondents to the CPE-MHN survey of property owners, one-third have seen the number of properties in their portfolios change by at least 10 percent over the past three years.
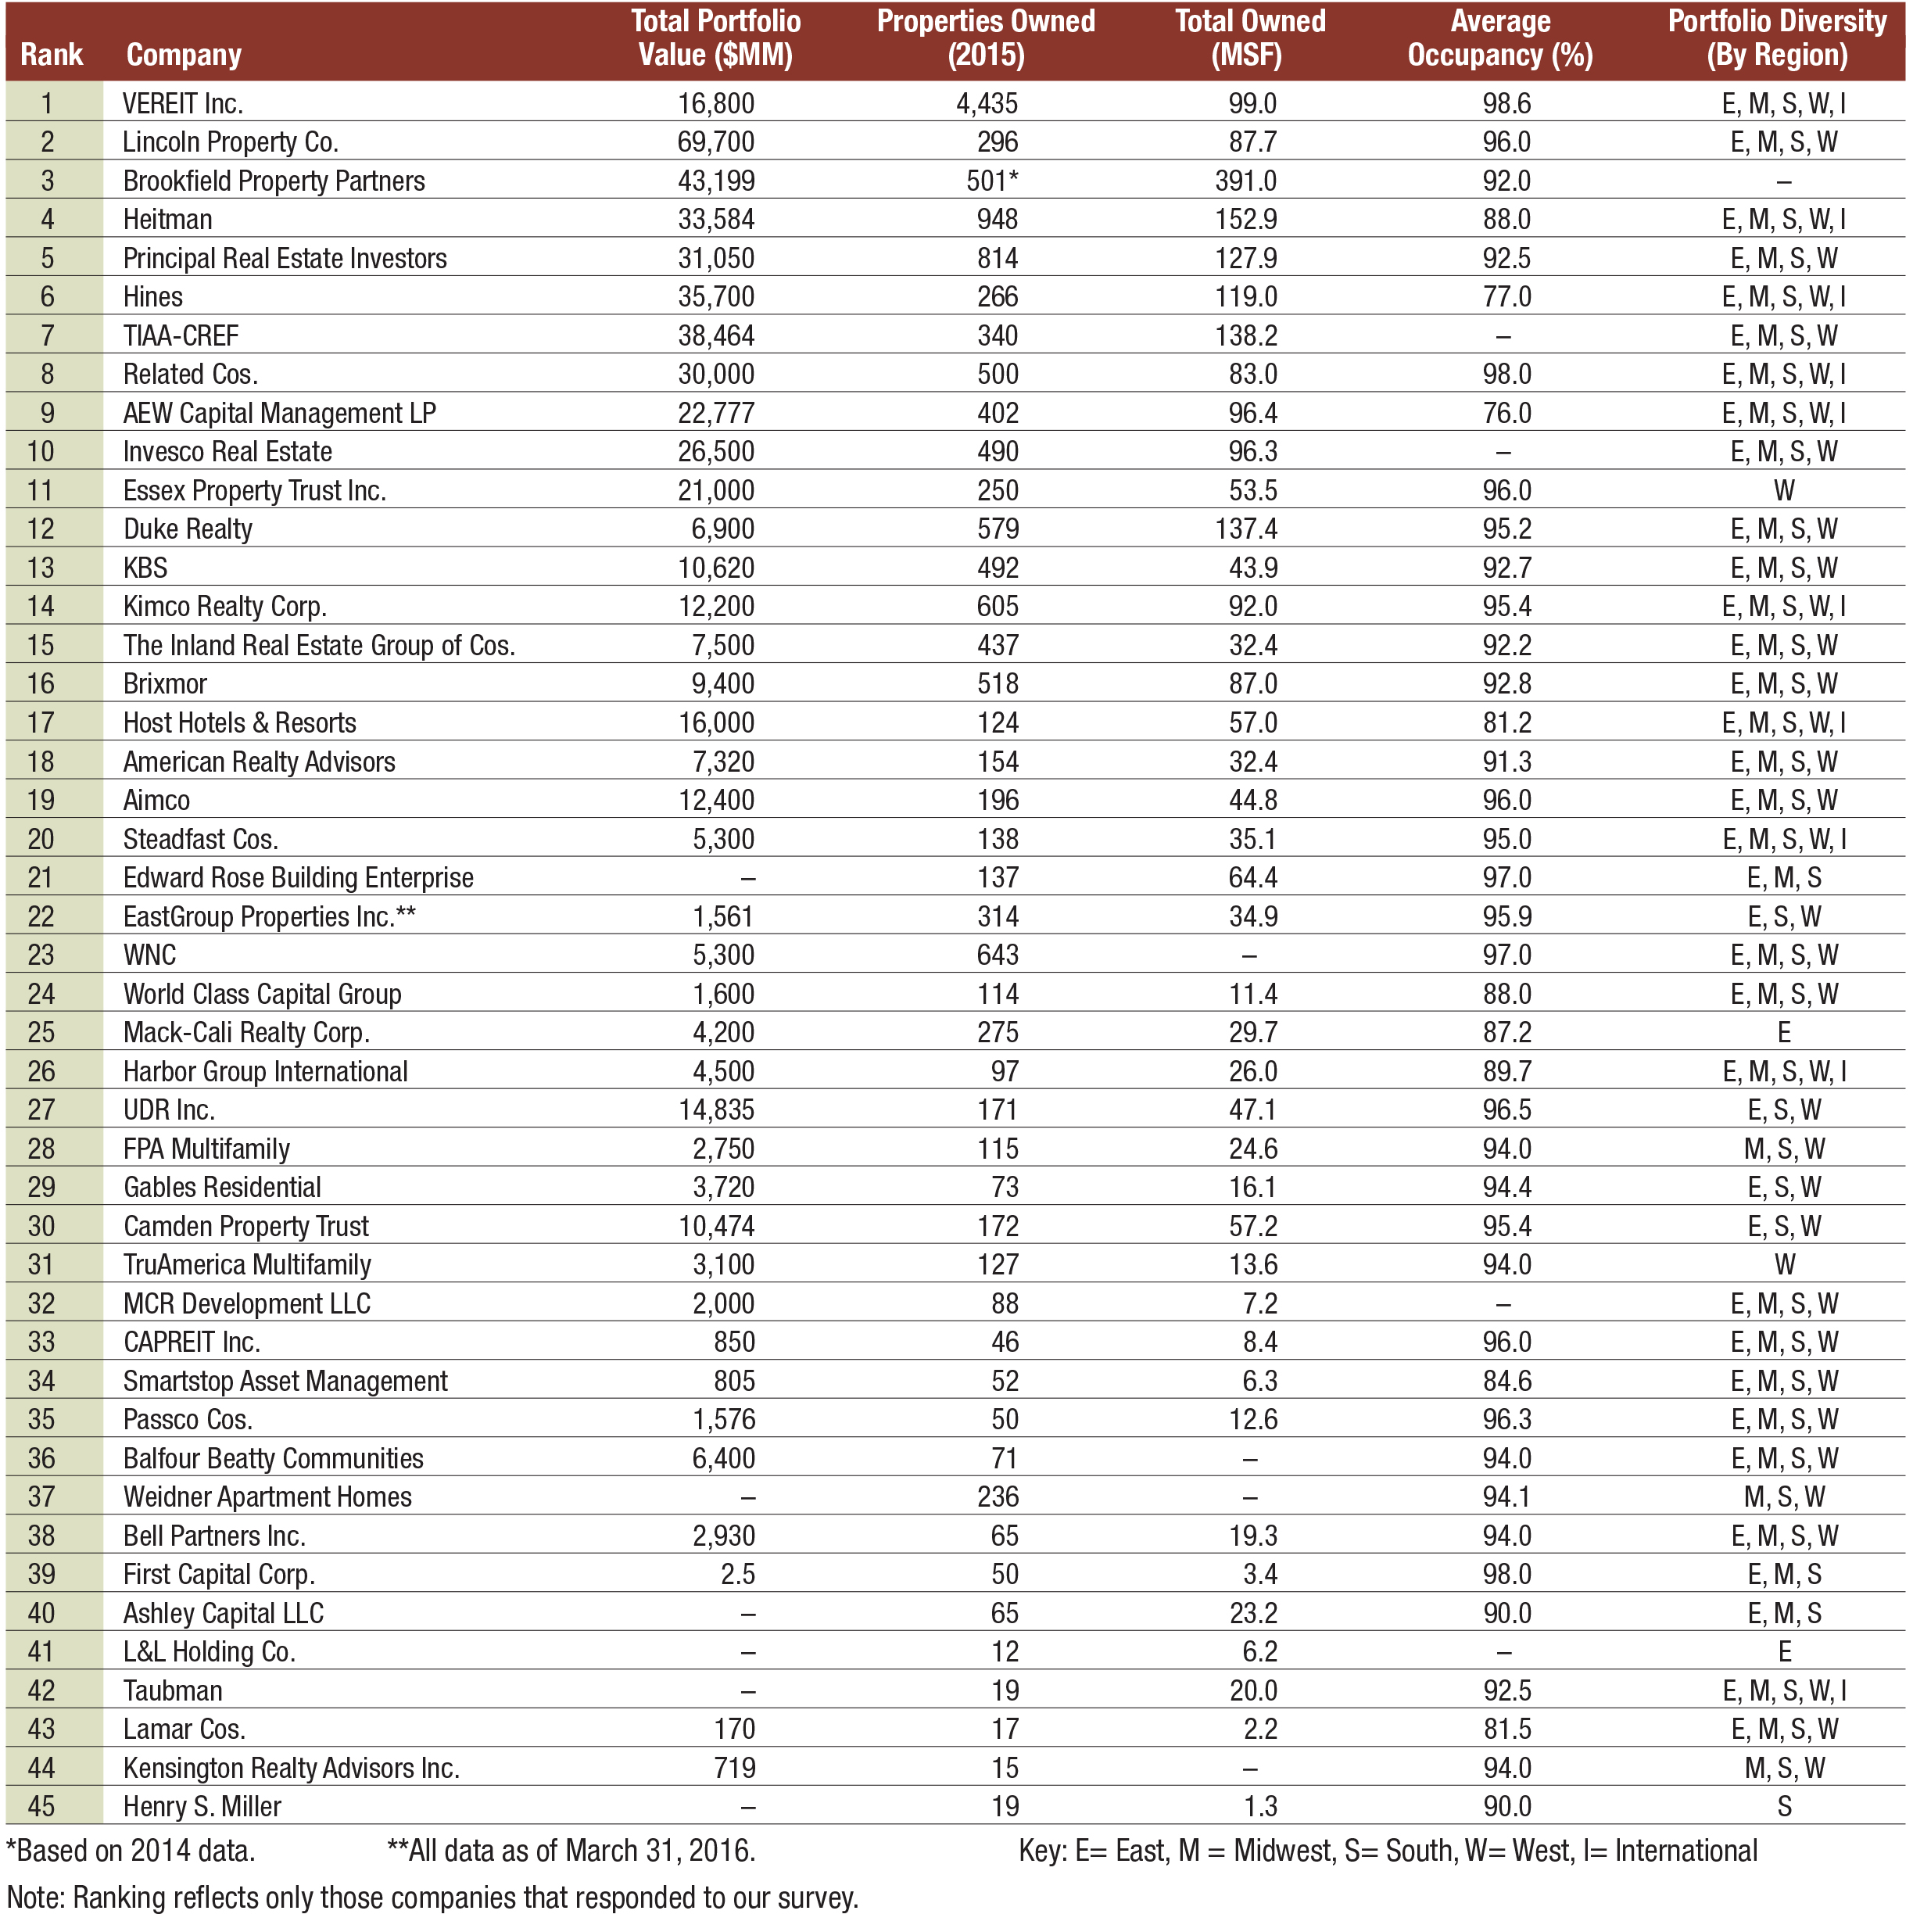
When it came to ranking property owners, dollar value and size of portfolio, both on a square footage and property count basis, proved to be critical. The top 10 owners hold roughly 60 percent of the properties and square footage of the total portfolio of the 45 survey respondents. On a dollar-value basis, 70 percent of the total portfolio is owned by the top 10 firms in our rankings.
Another key to landing atop the rankings is portfolio diversity, both geographically and across property types. In addition to operating in the four regions of the U.S., having an international presence helped, as six of the top 10 owned foreign properties. A diverse variety of property types was a factor shared by many of the firms in the top 10, as nine of them owned assets in five or more property types, and seven owned in six or more property types. Most owners held office, multifamily, retail and industrial within their portfolio, but many of the highly ranked firms also had significant senior housing, student housing and hospitality interests.
There is a strong mix of public and private firms atop the list of property owners, with six of the top 10 and three of the top four being publicly held REITs or financial firms. Privately owned firms comprise four of the top 10 owners.
As has been the case across the real estate industry, occupancy remains strong for the top property owners. Of the 41 firms that provided occupancy data, the average was 92.2 percent, with many of the top 10 firms reporting occupancy of 96 percent and above.
Methodology
The 2016 CPE-MHN Ranking of Top Commercial and Multifamily Owners utilized self-reported property characteristics for all firms. The ranking is a weighted formula based on a variety of factors (only a few of which are specified here), including the total square footage and number of properties owned, owned portfolio value, historic performance and participation in property sectors, among others. The ranking represents what we feel is a logical balance between firm growth and market share, as well as property diversity.
To be included in upcoming surveys, email Samantha Goldberg at samantha.goldberg@cpe-mhn.com.


You must be logged in to post a comment.