


2014 Top Commercial Owners
With nearly 2 billion square feet of real estate between them, the firms on 2014’s list of the Top Commercial Owners are some of the most successful real estate companies in the nation.
(Be sure to check out this month’s research podcast examining ownership trends. Also, check out Multi-Housing News for a look at how the leading apartment owners stack up.)
Slow and Steady
By Mike Ratliff & Jack Kern
With nearly 2 billion square feet of real estate between them, the firms on 2014’s list of the Top Commercial Owners are some of the most successful real estate companies in the nation. It’s not just the size of the portfolios—some of which are rapidly expanding—but the quality of assets and tenants that make these owners truly special.
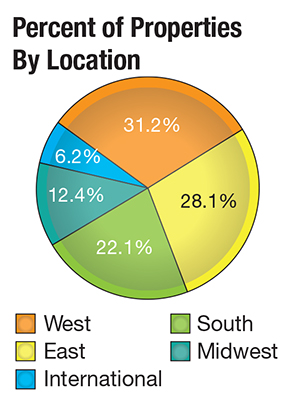 The mix of properties impressed us, as well, with submissions detailing more than 345 million square feet of office, 282 million square feet of retail, 458 million square feet of industrial and 648,000 apartment units. Average occupancy across all asset classes increased to 92.3 percent, up a healthy 30 basis points from last year’s survey.
Though multi-family continues to garner much attention due to demographic drivers and the fact that many young renters cannot yet afford to buy a home, the office, retail and industrial sectors continue to show fundamental improvements. Owners are taking note—especially with retail and industrial/e-commerce assets.
On average, the entire ownership portfolio carries 41.3 percent of its value in debt. While this is down from last year’s survey, which found debt to be 45 percent of value, we did see an overall increase in the percent of these portfolios with financing expiring over the next three years (28 percent of properties) and five years (44 percent of properties). Last year, 21 percent of properties had financing expiring over the next three years, while 35 percent had debt expiring over the next five.
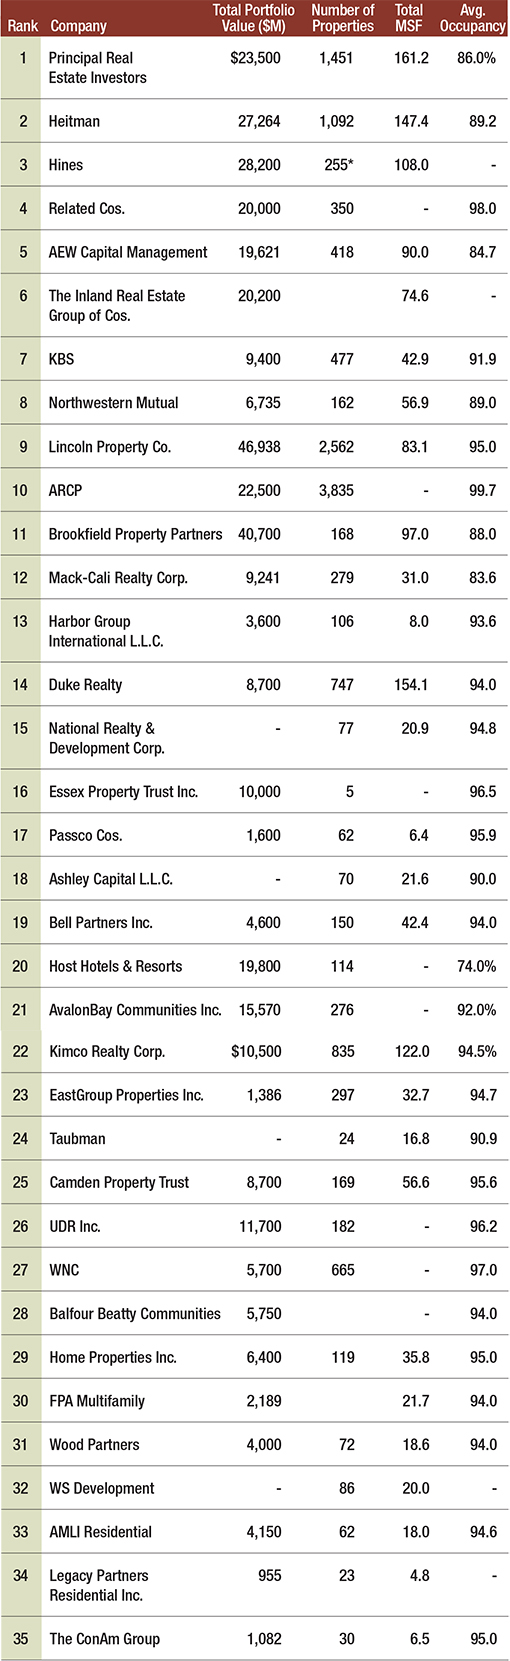
Note: Portfolio values as of close of first quarter 2014 unless otherwise noted. Property data as of May 31, 2014, unless otherwise noted. *As of Dec. 31, 2013
Methodology
Our ranking recognizes that the top multi-sector owners are best at knowing when, where and how to deploy capital. Variables factored into the ranking include information about their portfolios, their historic performance, the size and regional dominance of their holdings, details about ownership by square footage or units, occupancy dynamics, class and quality of properties, LEED certification, development plans and other items. The purpose of incorporating all of these variables is to help compare the composition of the firms’ portfolios and adjust for differences across their investment sectors and locations. Our findings reflect what we believe to be the most successful, innovative and industry-leading firms based on our examination of the information provided by each of these companies.


You must be logged in to post a comment.