


Uncategorized
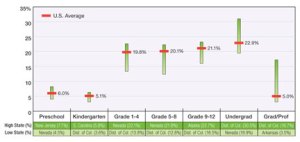
Back to School
(percent of states’ student population and their current level of enrollment)
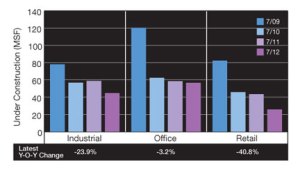
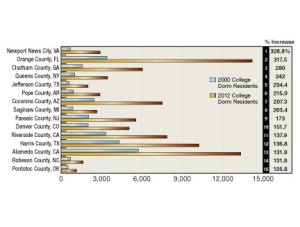
College Towns
(top U.S. counties for college & university dorm resident population growth, 2000 to 2012)
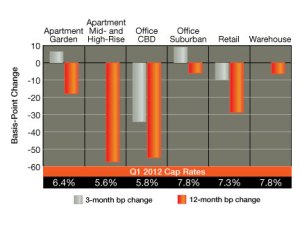
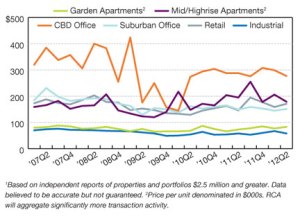
Inching Along
(national cap rate performance, based on properties and portfolios of $2.5 million and greater)
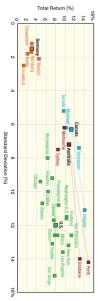
Asian Rebound
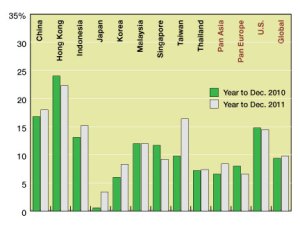
By Max Arkey There are now greater opportunities to be found in Asian versus European markets for U.S. investors seeking to diversify offshore. According to the latest IPD data, the unleveraged return on direct property investments in Asia was 8.4 percent in 2011, up modestly from 6.6 percent in 2010. European markets, in contrast, returned 6.6 percent over the course of 2011. The Pan Asia return is the weighted composite of the local currency returns for the nine markets shown in the graph above. Most markets have witnessed strengthening total returns, the exceptions being Hong Kong and Singapore. But the…