


Top 10 Markets for Office Deliveries in H1 2025
Completions in these metros account for more than half of the nation's new inventory, Yardi Matrix data shows.
The office sector continues to change as it faces a mix of unfavorable conditions, such as weak employment growth, high vacancies and demand for office space falling, Yardi Matrix data shows. During the first half of this year, the sector saw 17.7 million square feet of completed space across 133 properties. Office deliveries recorded a 35.5 percent drop from 2024’s first half, when the sector saw 27.5 million square feet across 198 properties that came online.
Construction starts included 9.2 million square feet across 106 projects at the end of 2025’s first half—a low level when compared to previous years and potentially marking a permanent shift in the nation’s office development. For context, during last year’s same period developers broke ground on 125 projects or 11.9 million square feet, 22.4 percent lower than this year’s first half inventory.
According to Yardi Matrix data, the top metros on our list had a combined 10 million square feet of completed office space. These metros accounted for 56.6 percent of the total square footage that came online as of June. Meanwhile, their combined under-development pipelines amounted to 22.7 million square feet, accounting for 30.2 percent of the national pipeline. Here are the top 10 office markets for deliveries and development:
1. San Francisco
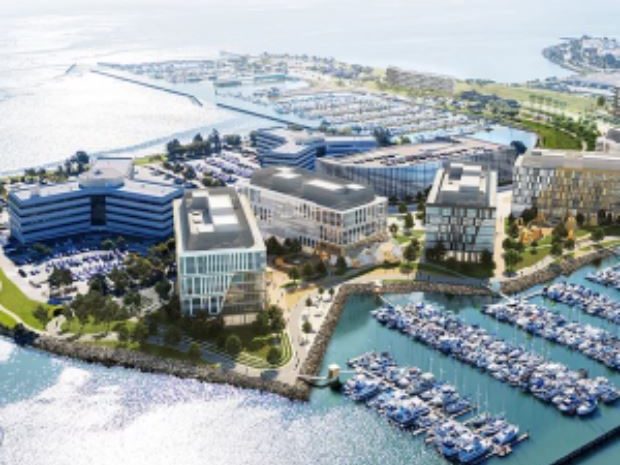
During the first six months of the year, San Francisco recorded 1.7 million square feet of delivered space across five properties, placing it on the first spot on our list. The figure represents a 30.8 percent jump when compared to the same period of 2024, when developers completed seven projects encompassing nearly 1.3 million square feet.
Significant office properties that came online included the second phase of Kilroy Oyster Point, a life science campus developed by Kilroy Realty in South San Francisco, Calif. Comprising 865,000 square feet across a trio of buildings, this $940 million development, part of the firm’s 3 million-square-foot waterfront campus, broke ground in 2021.
Meanwhile, Yardi Matrix data shows no construction starts in the metro as of June. For context, during the first half of last year, San Francisco had one property that broke ground, measuring 182,000 square feet.
However, the metro maintained a strong performance, particularly in relation to its under-development pipeline, that included approximately 2.4 million square feet across 11 projects. When compared to the 2024’s first half, when the metro had nearly 5.5 million square feet across 21 office developments, San Francisco saw a 56.1 percent drop so far, driven by the year’s ongoing economic challenges.\
2. Boston
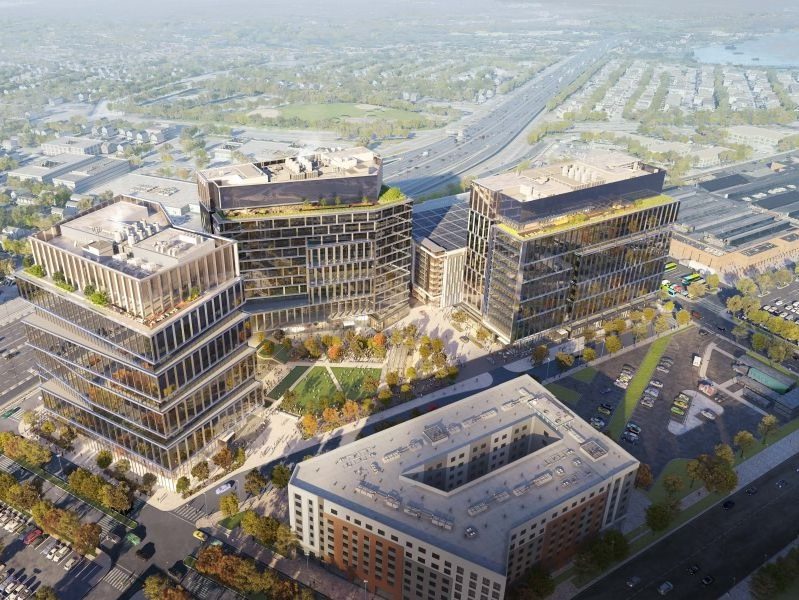
Boston ended the first half of the year as the runner-up in completions, with approximately 1.6 million square feet in new office space spread across six properties.
However, in 2024’s first half the metro saw 2.3 million square feet in delivered space across 10 properties—representing a 30.2 percent drop in this year’s new space. Deliveries in this metro may pick up in 2025, as the life sciences hub ended last year as the leader in completions.
An example of a recently completed property is BioMed Realty’s first phase of Assembly Innovation Park, one of the projects that will reshape Boston. Phase One, a 498,000-square-foot, 12-story tower with office and lab space, broke ground in 2022; the second phase is to include 970,000 square feet across two buildings.
Construction starts in Boston included only one 348,825-square-foot project—nearly 60 percent lower when compared to the 861,693 square feet that broke ground across three properties last year. The metro’s development pipeline in the first half of 2025 was the largest among the top 10 office markets on our list. However, Boston’s pipeline may spike even higher since there are 10 million square feet across 32 projects in the planning stages so far.
3. San Diego
The third-largest metro for office completions on our list is San Diego, another life sciences-driven market. As of June, there were nearly 1.2 million square feet of completed space across 11 properties—a 55.8 percent decline from the same period of 2024, when developers delivered 2.6 million square feet across 11 properties.
Meanwhile, San Diego’s pipeline included 2.4 million square feet across 13 projects. The largest one currently underway is 4135 Campus Point Court, a life science development rising in the metro’s University Town Center submarket. This 426,927-square-foot building is developed by Alexandria Real Estate Equities as part of its Alexandria Campus Point, an office and lab complex totaling 2 million square feet, fully preleased by Bristol-Myers Squibb Co.
Planned developments include 282,096 square feet across two projects while there were no new properties breaking ground in San Diego, Yardi Matrix data shows.
4. New Jersey
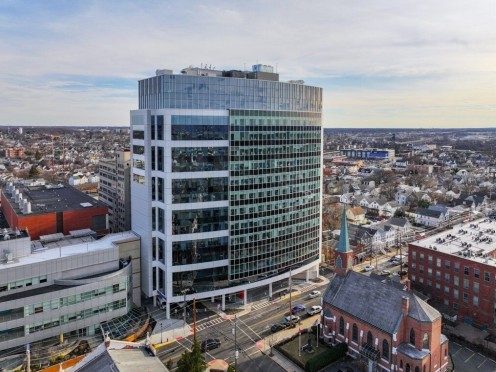
The fourth spot on our list is occupied by New Jersey, where the first half of the year saw 1.1 million square feet across five delivered properties. New Jersey recorded a massive expansion of 1,450.8 percent when looking at the same period of last year, For context, only 71,000 square feet of space across two properties came online in 2024’s first half.
One recently delivered property is a medical office building. In March, AST opened its Robert Wood Johnson University Hospital Ambulatory Medical Pavilion, a 229,000-square-foot, 15-story medical outpatient building in New Brunswick, N.J. The facility is part of a three-phase redevelopment started in 2006 and is master-leased by RWJBarnabas Health.
New Jersey’s under-construction pipeline included eight developments amounting to 1.1 million square feet, while six projects totaling 640,082 square feet were in the planning stages. Construction starts comprised 324,680 square feet—a 265.8 percent jump when compared to the 88,747 square feet that broke ground during the same period of last year.
5. Charlotte
Another market that recorded an expanded inventory in the year’s first half is Charlotte. The metro saw approximately 1.1 million square feet across three completed projects. When compared to the previous year’s first half, when developers delivered only two properties totaling 377,768 square feet, Charlotte’s completions marked a 117.7 percent spike.
As of June, there were 611,447 square feet across five projects underway in Charlotte, while nine other projects totaling 2.1 million square feet were in the planning stages. Meanwhile, developers broke ground on one development of 120,000 square feet—representing a 232.2 percent spike when compared to 2024’s first half, that saw only 36,124 square feet in construction starts.
6. Dallas-Fort Worth
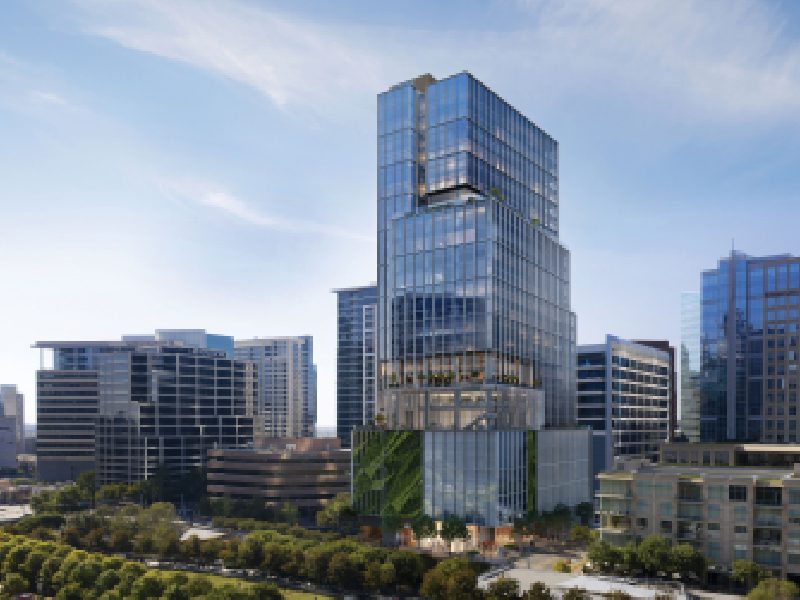
The Metroplex’s completions amounted to 934,310 square feet across seven buildings. The amount of deliveries was 13.8 percent higher year-over-year, when 820,978 square feet came online.
Completions may pick up in Dallas as there were nearly 4 million square feet across 29 properties under construction. One of the largest projects underway in the metro is Parkside Uptown, a 500,000-square-foot office tower in Plano, Texas. Developed by Pacific Elm Properties and KDC, it broke ground in 2023, being financed by a $290 million construction loan.
Construction activity in the metro also recorded 16 planned projects, estimated to add 7.1 million square feet to the metro’s active pipeline.
7. The Bay Area
The seventh metro on our list saw 847,000 square feet of delivered space across only one property as of June—marking a 113.3 percent increase when compared to the half-point of 2024. At the time, the metro had 397,030 square feet across two properties that came online.
However, the Bay Area’s completions may pick up this year as the metro’s active pipeline included 3.3 million square feet across 11 properties in June. Another 16 projects were in the planning stages, estimated to add 4.4 million square feet.
Construction starts in the Bay Area also marked an impressive jump: Three projects, totaling 844,367 square feet, broke ground in the metro as of June, up 405.6 percent from the same period of the previous year. For context, the Bay Area had only one development, measuring 167,000 square feet, that debuted in 2024’s first half.
8. Sacramento
Sacramento occupies the eighth spot on our list. This metro added 555,447 square feet of completed space across two properties—a 55.6 percent drop from the nearly 1.3 million square feet that came online in 2024’s first half.
There were five developments totaling 1.1 million square feet underway at the end of June, while seven other projects were in the planning stages, set to add another 1.1 million square feet to the market’s active pipeline. Three projects, totaling 335,500 square feet, broke ground in the first half of the year.
9. Baltimore
Baltimore’s completions totaled 550,000 square feet pertaining to only one property. The figure marks a 291.9 percent jump from the same period of last year, when developers completed only 140,338 square feet across two properties in the metro.
At the end of June, this metro had three projects underway, totaling 295,000 square feet, while five projects amounting to 314,004 square feet were in the planning stages.
10. Washington, D.C.
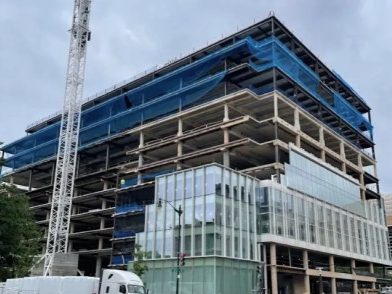
The nation’s capital had three properties completed in the first half of the year, totaling 511,864 square feet and placing the metro on the last spot on our list. This represents a 57.9 percent drop from 2024, when seven completed properties added 1.2 million square feet to the metro’s inventory.
As of June, developers started construction on three properties totaling 97,759 square feet—a 63.8 percent decrease from the 270,000 square feet that broke ground in 2024.
The largest development currently underway in the capital is 600 Fifth St. NW, developed by Rockefeller Group and Stonebridge. The partnership topped out the 400,000-square-foot office building in May last year and completion is expected in 2026.



You must be logged in to post a comment.