

Industrial Report: Construction Rebounds Despite Rising Development Costs
Industrial construction is gaining momentum despite rising costs, power constraints and development hurdles, according to Yardi Matrix.
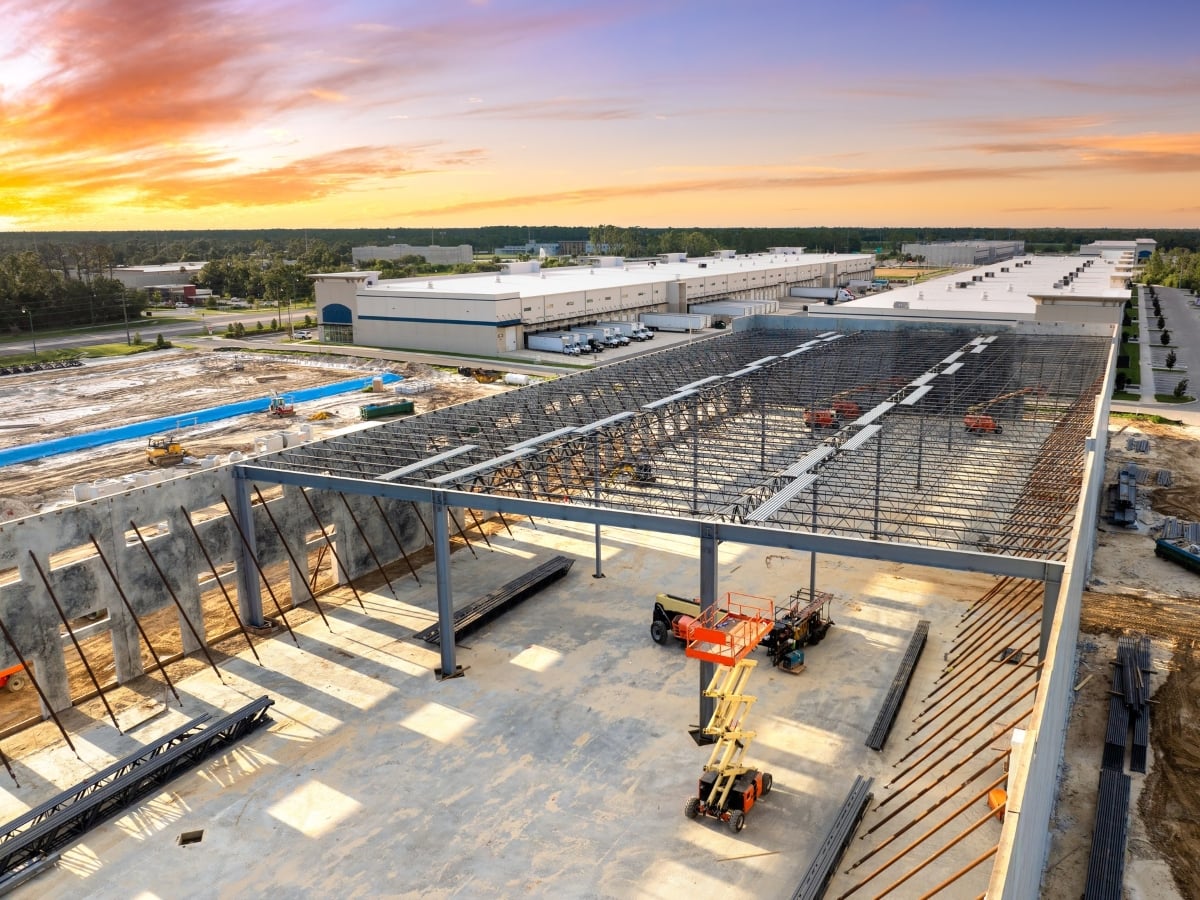
Industrial development is picking up pace in 2026, despite rising construction costs, power constraints and longer approval processes. According to the October 2026 Yardi Matrix Industrial National Report, developers broke ground on 274.4 million square feet during the first three quarters of the year, putting construction starts on track to potentially reach their highest annual level since 2022.
Power availability has become a major hurdle, influencing site selection and project feasibility. Developers also face growing community opposition over traffic, air quality and land use, while lengthy entitlement processes make shovel-ready sites increasingly valuable.
Construction costs are adding further pressure. Prices for new nonresidential construction inputs rose 11.9 percent year over year in September, with tariffs driving sharp increases in metal prices. Despite these obstacles, development starts are expected to continue increasing modestly, although supply constraints could support rent growth over the longer term.
Dallas leads rent growth as vacancy rises
National in-place industrial rents averaged $9.33 per square foot in September, increasing two cents from August and 5.3 percent over the previous 12 months. Dallas–Fort Worth led annual rent growth at 7.9 percent, followed by Miami at 7.5 percent. Atlanta and the Inland Empire each recorded 7 percent growth. Miami’s sustained performance reflects its trade connections with Latin America and the Caribbean, continued population growth and limited availability of development land.
READ ALSO: Which Trade Disruptions Are Really Reshaping Industrial Demand?
Meanwhile, national industrial vacancy reached 9.7 percent, rising 40 basis points month over month and 20 basis points annually. Leases signed during the previous 12 months averaged $10.13 per square foot, just 80 cents above the national in-place average. That premium has narrowed by 48 cents over the past year and $1.40 over two years. However, Bridgeport retained the largest new-lease premium at $3.98 per square foot, followed by Miami at $2.79.
Development pipeline expands as Chicago sales accelerate
Industrial space under construction totaled 463.3 million square feet nationally in September, representing 2.2 percent of existing inventory. The pipeline has expanded considerably from January, when 357.4 million square feet was underway. Owner-occupied facilities have also become a substantial component of new development, accounting for 27 percent of starts during the first three quarters of 2026, or 76.1 million square feet.
Dallas led the markets tracked in the supply table with approximately 39.6 million square feet under construction, followed by Phoenix with 31.4 million and Houston with 23.3 million. Phoenix had the highest construction concentration, with projects underway representing 6.9 percent of existing stock. Its combined under-construction and planned pipeline reached 14.4 percent of inventory, underscoring the market’s continued development activity.
Industrial investment volume reached $74.7 billion through September, with properties trading at an average of $140 per square foot. Dallas–Fort Worth led transaction volume at approximately $5.1 billion, while Chicago followed with $4.4 billion. Chicago’s average sales price reached $123 per square foot, partly reflecting a $750 million data center acquisition in Elk Grove Village.
Excluding data centers, Chicago’s average industrial sale price stood at $101 per square foot, still 10.3 percent above its 2025 level. The October findings highlight continued investor activity alongside a construction rebound increasingly shaped by development costs and infrastructure availability.




You must be logged in to post a comment.