Core and Opportunistic Funds Return
The exhibit compares unlevered asset performance from core open-ended funds in the MSCI database with opportunistic fund performance from Preqin Ltd.
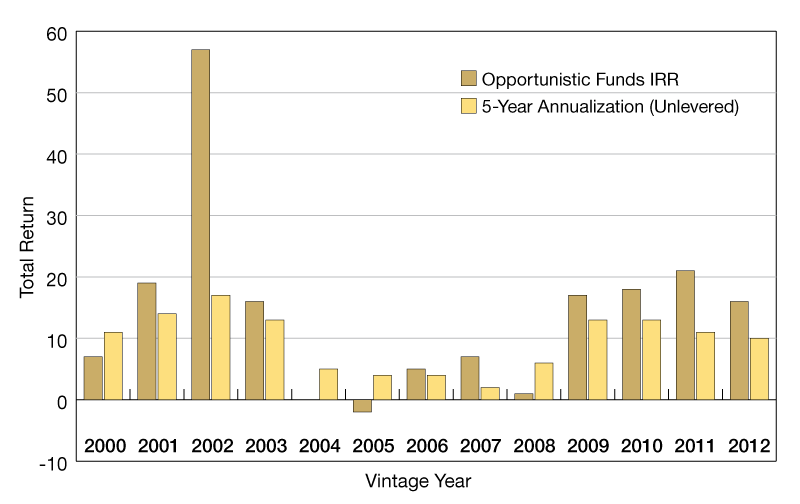
The 2002 Vintage Preqin data is skewed by the performance of one fund with an IRR in excess of 200 percent. The median IRR for this vintage was 18.8 percent.
Source: MSCI Global Intel PLUS (unlevered returns) and Preqin Ltd. (opportunistic funds)
Real estate investors sometimes treat core and opportunistic funds as if they were different asset classes. They are measured against different benchmarks and comparisons are limited by a lack of consistent data. But a comparison of the two shows that both core and opportunistic funds have similar return profiles—it’s the magnitude of their returns that has varied over time.
A comparable analysis between core and opportunistic funds is currently limited by a lack of consistent data. The exhibit compares unlevered asset performance from core open-ended funds in the MSCI database with opportunistic fund performance from Preqin Ltd. The MSCI time-series shows the forward five-year total return compound annual growth rate (CAGR) at each point in time. The Preqin data shows the realized IRR of opportunistic funds by vintage.
Although the data is not precisely comparable, the analysis illustrates at a very basic level, that both types of real estate risk profiles appeared to follow similar cyclical trends between the vintage years 2000 through to 2012. By improving the sophistication and consistency of risk analysis across the entire spectrum of their holdings, real estate investors may be able to gain valuable insights using relative market analysis for opportunistic strategies.


You must be logged in to post a comment.