Retail (Occupancy)
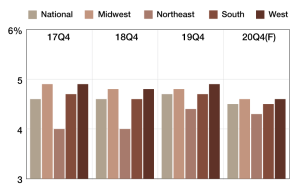
2019 National Retail Occupancy
Year-over-year retail vacancy rate percentages compared nationally and by region, updated quarterly.
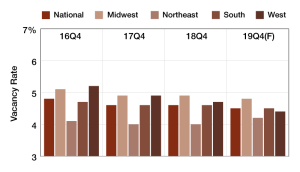
2018 National Retail Occupancy
Year-over-year retail vacancy rate percentages compared nationally and by region, updated quarterly.

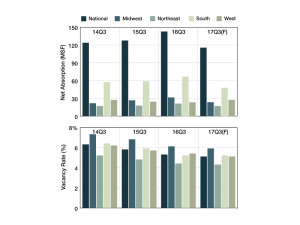
National Vacancies
Year-over-year, vacancy rates for retail markets decreased in almost all the regions, with the largest change coming from the Midwest, from 6 percent to 5.6 percent in the second quarter of 2017.

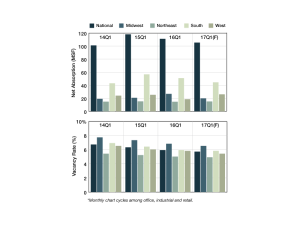
National Vacancies
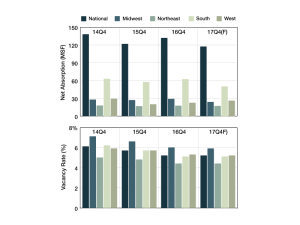
Forecasts show that net absorption is expected to rise in the first quarter of 2018 only in the West region (33.5 percent) and is expected to decrease in the rest of the regions.
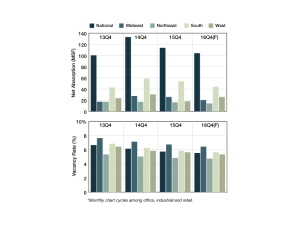
National Vacancies
Forecasts show that net absorptions are expected to rise in the fourth quarter of 2017 in the West region and to decrease by approximately 20 percent in the South. Vacancy rates are expected to remain almost the same in the fourth quarter of this year.