

Manhattan Keeps Spot at the Top of US Office
Billion-dollar transactions and tightened vacancy set the market apart as the sector enters a new phase of stabilization.
Manhattan ended 2025 as the nation’s strongest performer across multiple key metrics, according to Yardi Matrix.
Despite ongoing shifts in office demand, investment activity in the metro surged, with investors trading $7.8 billion—the highest in the U.S. Office pricing rebounded sharply from 2024 values, while vacancy fell to the lowest level nationwide. Development activity remained elevated when compared to peers. the metro’s pipeline is supported by large or preleased projects while new deliveries have yet to be absorbed.
Manhattan topped the charts for sales as prices recovered
Investor appetite in Manhattan jumped notably in 2025. At the end of last year, the metro recorded $7.8 billion in deals, securing the top spot in the nation. Metros that followed included the Bay Area ($4.8 billion) and Washington, D.C. ($3.8 billion). Regarding gateway markets only, the two lowest-performing ones were Seattle ($779 million) and Miami ($771 million).
Despite last year seeing more than 40 percent of the total U.S. transactions as discounted sales, Manhattan’s dollar volume in 2025 hit a massive growth—of 90.3 percent specifically. For comparison, Manhattan’s 2024 sales amounted to $4.1 billion.
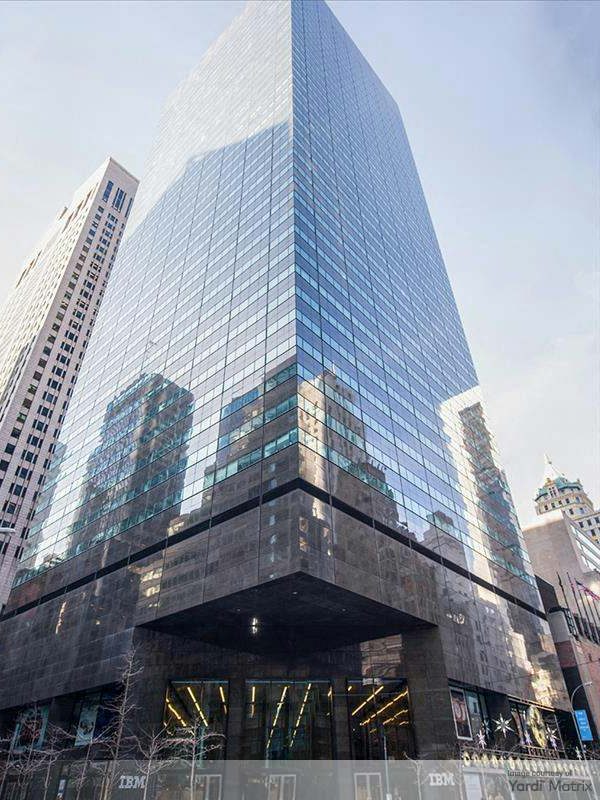
The largest office deal in 2025 was the $1.1 billion acquisition of 590 Madison Ave. RXR Realty purchased the 1 million-square-foot office tower in August 2025. The State Teachers Retirement System of Ohio sold the 43-story property.
This was the only Manhattan transaction to cross $1 billion in 2025, according to Yardi Matrix, while also representing the largest acquisition in New York City since 2022.
The borough kept its spot as the most expensive office market. At the end of 2025, office assets in the metro sold at $498 per square foot—way above the national average of $192 per square foot. The Bay Area followed, with $392 per square foot, while Miami’s $369 per square foot average price placed it third nationally. The $498 per square foot value in Manhattan also represented a remarkable recovery from 2024—a 36.8 percent jump, specifically. Back in December 2024, office assets in the metro sold at $364 per square foot.
Vacancy declines sharply, rents stay elevated
Manhattan office space‘s vacancy rate clocked in at 13.6 percent as of December 2025—below the 18.4 percent national rate and representing the lowest rate in the U.S. The 13.6 percent rate marked a 300-basis-point drop over the past 12 months.
For several years, vacancies across most key markets rose sharply. However, the elevated rates began to fall in 2025. After peaking in March 2025, there has been a revival among multiple markets, with Manhattan leading the way. In December last year, the borough’s 13.6 vacancy rate stood out as the lowest in the U.S. For context, Miami’s 13.9 percent rate was the only similar value, while elevated rates were recorded across multiple metros. These included San Francisco (25.2 percent) and Seattle (27.2 percent).
As for rents, the borough’s average full-service equivalent listing rate was $68.36 per square foot at the end of last year—way above the $32.86 per square foot national figure. Manhattan stood out again as the top metro for expensive rents.
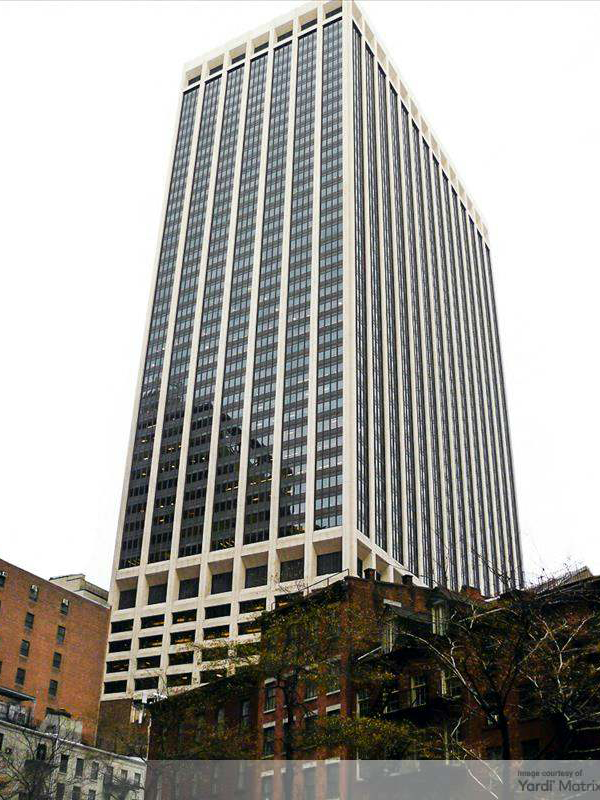
Retirement Systems of Alabama since 1993. Image courtesy of Yardi Matrix
Other metros following closely included San Francisco ($63.15 per square foot) and Miami ($55.39 per square foot). On the end of the spectrum, the country’s most affordable rents were recorded in Detroit ($21.46 per square foot), while the lowest rents across gateway cities were in Chicago ($28.31 per square foot).
Moreover, office traffic across the nation gained ground in December last year—the busiest in-office December since the pandemic, according to a recent Placer.ai Office Index. In New York City, the office recovery rate was 19.6 percent lower at the end of 2025 compared to December 2019, paving the way for a dynamic office shift.
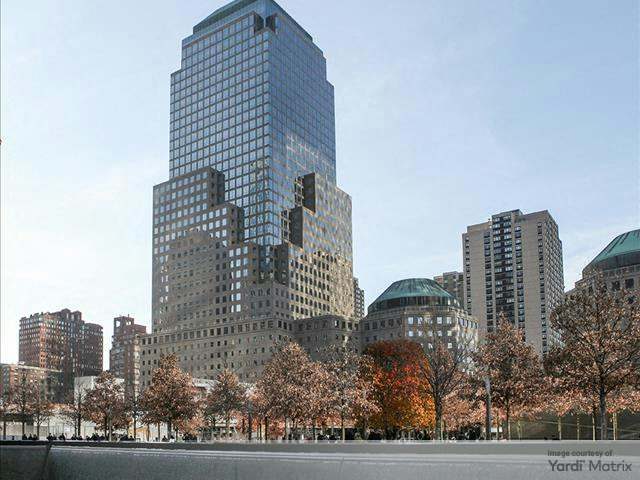
Leasing activity in the metro reached high levels during the last months of 2025. One notable deal is Moody’s Corp.’s 460,000-square-foot lease at 200 Liberty St. in Lower Manhattan. The company will move its global headquarters in 2027 at the Brookfield Properties-owned building.
Large-scale projects sustain construction activity
As of December 2025, Manhattan had 2.7 million square feet underway across seven projects. Among gateway markets, the metro placed second after Boston, where 5.4 million square feet were under development.
For competitive space specifically, the metro had 2.3 million square feet of space under construction, representing 0.5 percent of its existing stock—slightly above the national average of 0.4 percent. This marked the third-largest pipeline among the top 25 U.S. markets, with Boston keeping the top spot at 4.4 million square feet and Dallas placing second, with 2.7 million square feet.
On the other hand, Seattle and Chicago stood out as the gateway cities with the smallest pipelines, at 252,963 square feet and 571,576 square feet, respectively.
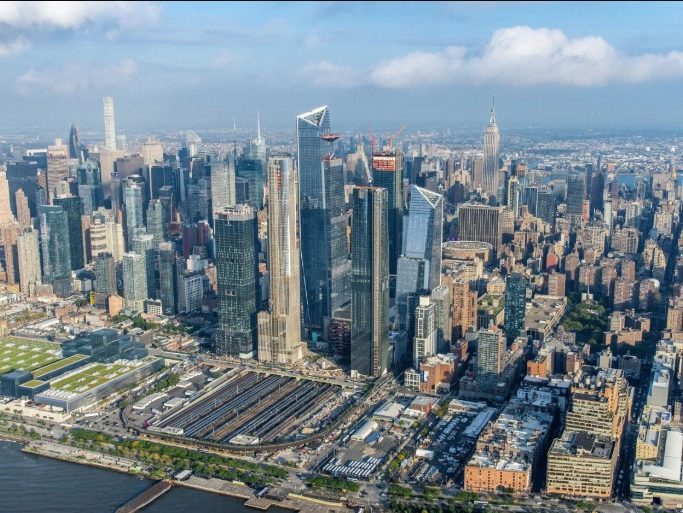
The top five largest projects total 2.5 million square feet combined. At the top of the list is 70 Hudson Yards, totaling 1.1 million square feet. Related Cos. broke ground in June 2025. Deloitte signed a 800,000-square-foot lease at the project a month earlier, with plans to relocate its North American headquarters.
At the end of 2025, developers in the borough added 3.3 million square feet across five office projects. This amount of office completions represented 0.7 percent of the metro’s existing stock and hit a remarkable growth from the 2024 activity—a 130.6 percent year-over-year increase, specifically.
Manhattan retains the largest coworking footprint in the U.S.
At the end of last year, Manhattan’s coworking sector comprised 12.5 million square feet of space across 299 locations, according to CoworkingCafe. The metro’s share of coworking space accounted for 2.5 percent of total leasable office space—above the national average of 2.2 percent and on par with Los Angeles. Among gateway markets, Miami reached the highest share, at 4 percent, while Chicago followed, with 2.7 percent.
The borough had the largest coworking inventory. Metros that followed included Chicago (9 million square feet) and Los Angeles (7.5 million square feet), while Miami’s 3.2 million square feet inventory was the lowest among gateway cities.
Manhattan’s list of top five largest flex office providers remained unchanged since our previous coverage. WeWork kept the largest footprint in the metro, totaling 2.3 million square feet across 28 locations. Operators that followed included Industrious (1.5 million square feet), Grand Central Offices (848,640 square feet), Studio by Tishman Speyer (753,350 square feet) and Regus (651,360 square feet).


You must be logged in to post a comment.