

2023 New Orders
The value of manufacturers’ new orders across multiple industries, updated monthly.
Not seasonally adjusted; $ in millions
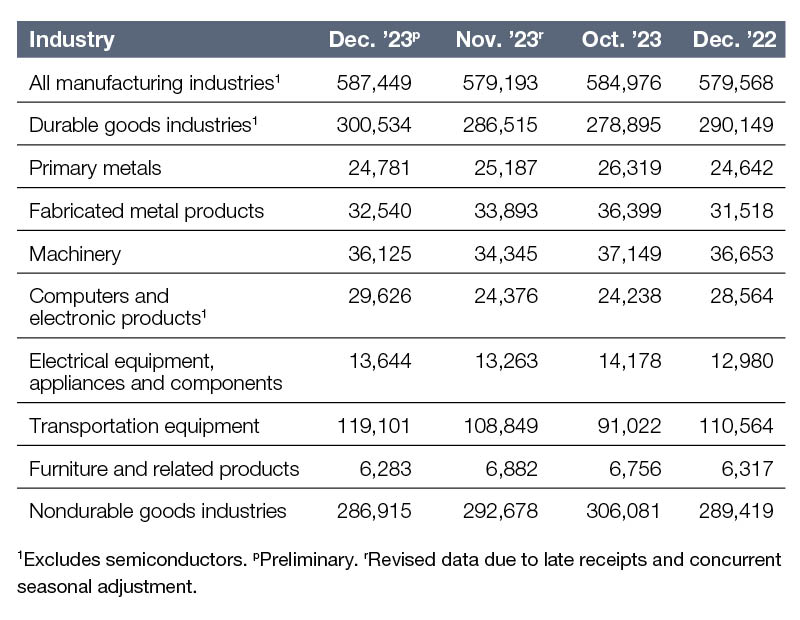
As of December 2023, new orders increased by an average of 1.3 percent, equal to $7.9 million, according to data from the U.S. Census Bureau. Compared to December 2022, the most significant uptick came from the Transportation Equipment sector, where new orders climbed by 7.7 percent. The Electrical Equipment, Appliances and Components segment followed with a 5.1 percent gain, Computers and Electronic Products recorded a 3.7 percent increase, followed by Durable Goods Industries, where orders were up by 3.6 percent.
Year-over-year, all but three surveyed manufacturing industries followed negative growth patterns. As of December, the steepest decrease came from the Machinery sector, where the rate stood at -1.4 percent. Meanwhile, orders recorded a 0.8 percent decrease for Nondurable Goods Industries. At the same time, Furniture and Related Products recorded a 0.5 percent decrease.
On a month-over-month basis, new orders increased by an average of 1.4 percent—equal to $8.2 million—as of December. Similar to year-over-year trends, growth in new orders was uneven across all surveyed industries. The most notable increase came from Computers and Electronic Products, where orders grew by 21.5 percent. Orders in the Transportation Equipment segment increased by 9.4 percent, orders for Machinery recorded a growth of 5.2 percent, and orders in the Durable Goods Industries sector posted a 4.9 percent change.
Meanwhile, orders for four industries recorded negative growth rates. Orders for Furniture and Related Products decreased by 8.7 percent, while Fabricated Metal Products was down by 4.0 percent. Nondurable Goods Industries recorded a 1.9 percent decrease, followed by Primary Metals, where orders were down by 1.6 percent.
—Posted on Feb. 29, 2024
Not seasonally adjusted; $ in millions
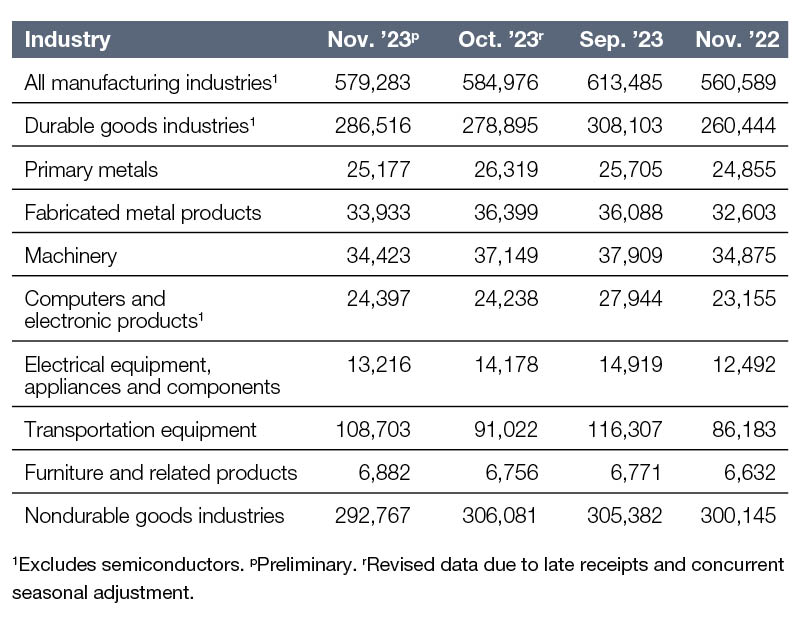
Year-over-year through November 2023, new orders increased by an average of 3.3 percent, equal to $18.7 million, based on data from the U.S. Census Bureau. The most substantial rise in new orders during this period occurred in the Durable Goods Industries sector, which saw a 10.0 percent increase compared to November 2022. Following closely behind was the Electrical Equipment, Appliances and Components sector, with a 5.8 percent growth, and the Computers and Electronic Products sector, which saw a 5.4 percent uptick. Orders for Furniture and Related Products were up by 3.8 percent, followed by Primary Metals, were orders increased by 1.3 percent.
However, the year-over-year evolution of new orders remained inconsistent, with four sectors experiencing negative growth rates as of November 2023. Fabricated Metal Products saw the most significant decline, with a 10.4 percent decrease, and Transportation Equipment recorded a 5.3 percent drop. Additionally, the Nondurable Goods Industries sector had a 2.4 percent decrease, followed by Machinery with a 1.3 percent decrease.
Looking at the month-over-month data as of November 2023, new orders remained relatively stable, with an average increase of 0.9 percent, amounting to $5.7 million. Similar to the year-over-year trend, new orders decreased in most surveyed industries, except for four. The most significant growth was observed in the Transportation Equipment sector, where orders surged by 19.4 percent. Durable Goods Industries followed with a 2.7 percent improvement, while the Furniture and Related Products sector saw a 1.9 percent increase, and the Computers and Electronic Products sector experienced a 0.6 percent rise.
On the other hand, the Machinery sector saw a notable decline of 7.3 percent in new orders, followed by Electrical Equipment, Appliances and Components (-6.8 percent) and Fabricated Metal Products (-6.7 percent). Orders for Nondurable Goods Industries and Primary Metals recorded a 4.3 percent decrease each.
—Posted on Jan. 31, 2024


You must be logged in to post a comment.