

2021 New Orders
The value of manufacturers’ new orders across multiple industries, updated monthly.
Not seasonally adjusted; $ in millions
Source: U.S. Census Bureau
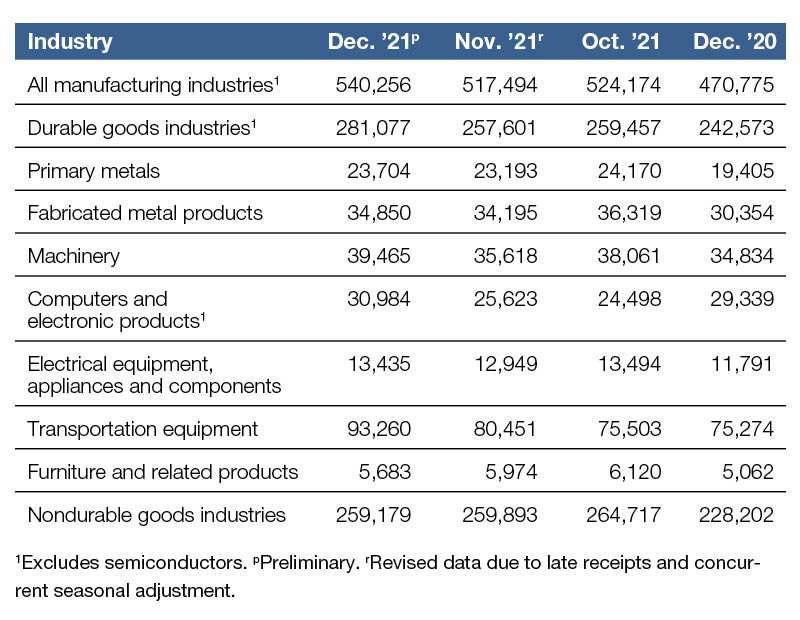
Year-over-year, new orders increased by an average 14.7 percent—equal to $69.5 million—as of December, according to data from the U.S. Census Bureau. Compared to December 2020, new orders for Transportation Equipment recorded the highest increase, jumping 23.9 percent. The Primary Metals sector followed closely with a 22.1 percent increase, while Durable Goods Industries came in third, with orders posting a15.8 percent improvement.
Every manufacturing industry recorded steady year-over-year increases in terms of new orders. As of December, the only sector to record a single-digit uptick was Computers and Electronic Products, with a 5.6 percent increase.
On a month-over-month basis, new orders increased by a 4.4 percent—equal to $22.7 million—as of December. Following the same pattern of the year-over-year climbs in new orders, the monthly changes were positive across nearly every surveyed industry. Three sectors recorded double-digit increases: Orders in Computers and Electronic Products jumped by 20.9 percent, Transportation Equipment recorded a 15.9 percent increase, while Machinery jumped 10.7 percent.
Two industries recorded negative growth month-over-month as of December: New orders for Nondurable Goods Industries were down by 0.2 percent, while Furniture and Related Products recorded a 4.8 percent decrease.
—Posted on Feb. 28, 2022
Not seasonally adjusted; $ in millions
Source: U.S. Census Bureau
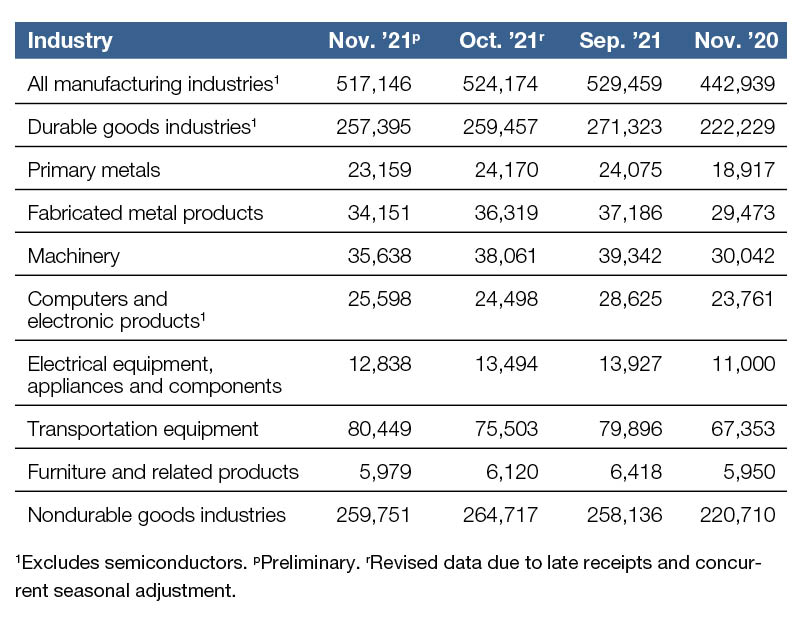
As of November 2021, new orders increased on a year-over-year basis by an average of 16.7 percent, equal to $74.2 million, based on data from the U.S. Census Bureau. Compared to November 2020, new orders climbed most in the Primary Metals sectors, up by 22.4 percent. Transportation Equipment followed with a 19.4 percent increase as of November, while orders in the Nondurable Goods Industries grew by 17.7 percent.
New orders continued their positive trajectory in terms of year-over-year evolution, although growth across all sectors was uneven. As of November, two sectors registered single-digit improvements: Orders for Computers and Electronic Products rose by 7.7 percent, while Furniture and Related Products recorded a 0.5 percent increase in new orders.
Month-over-month, new orders decreased by an average of 1.3 percent—equal to $7 million—as of November. Only two sectors recorded positive gains: Orders for Transportation Equipment climbed by 6.5 percent and Computers and Electronic Products followed with a 4.5 percent improvement.
Every other industry recorded negative growth: Orders for Machinery were down by 6.4 percent, followed by Fabricated Metal Products (-5.9 percent), Electrical Equipment, Appliances and Components (-4.9 percent), Primary Metals (-4.2 percent) and Furniture and Related Products (-2.3 percent).
—Posted on Jan. 31, 2022
Not seasonally adjusted; $ in millions
Source: U.S. Census Bureau
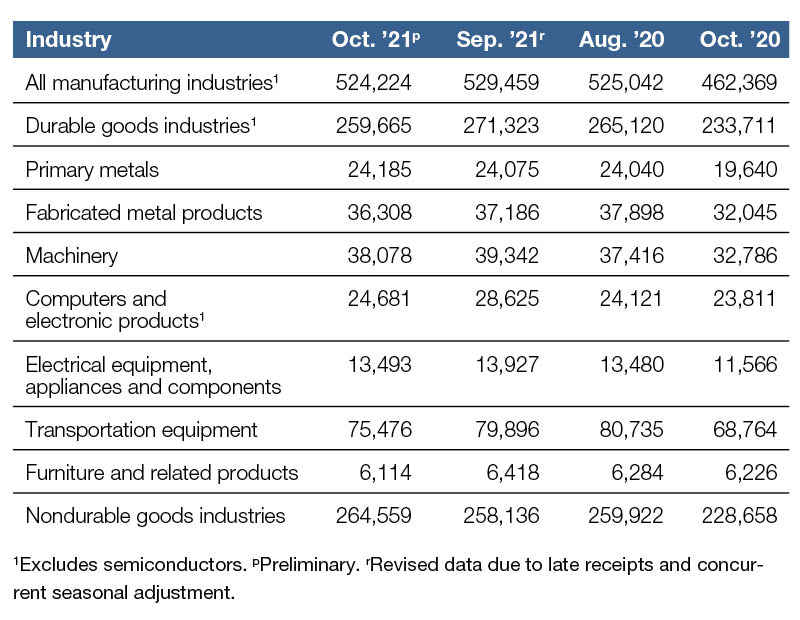
Year-over-year through October, new orders increased by an average of 13.3 percent, equal to $61.8 million, according to data from the U.S. Census Bureau. Compared to October 2020, new orders recorded the highest increase in the Primary Metals sectors, up by 23.1 percent. Electrical Equipment, Appliances and Components followed with a 16.6 percent climb, while orders in the Machinery segment increased by 16.1 percent.
New orders continue their steady climb in terms of year-over-year evolution. As of October, two sectors registered single-digit improvements: Orders for Transportation Equipment rose by 9.7 percent, while Computers and Electronic Products clocked in with a 3.6 percent increase in new orders. A single industry—Furniture and Related Products—recorded negative growth year-over-year as of October, down by 1.8 percent.
Month-over-month, new orders decreased slightly, down by an average of 0.9 percent—amounting to $5.2 million—as of October. Orders in Nondurable Goods Industries recorded the highest increase, climbing by 2.5 percent. Primary Metals followed with a 0.4 percent improvement.
Meanwhile, the rest of the industries recorded negative growth from the month prior. Orders in the Fabricated Metal Products were down by 2.3 percent. Meanwhile, orders for Machinery and Electrical Equipment, Appliances and Components recorded a 3.2 and 3.1 percent drop, respectively, followed by Furniture and Related Products (-4.7 percent) and Durable Goods Industries (-4.3 percent). The Computers and Electronic Products segment recorded the most significant decrease in orders, clocking in at 13.7 percent.
—Posted on Dec. 21, 2021
Not seasonally adjusted; $ in millions
Source: U.S. Census Bureau
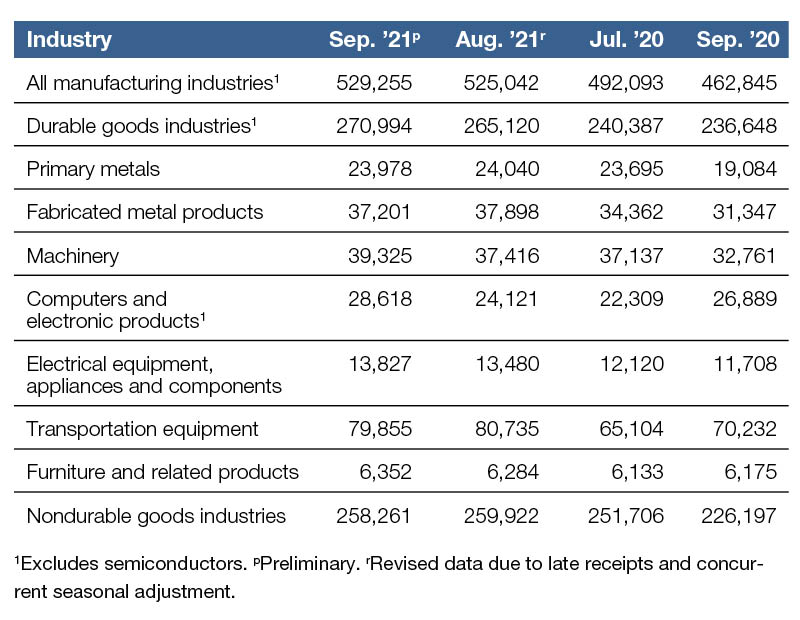
Year-over-year, new orders increased by an average 14.3 percent—equal to $66.4 million—as of September, according to data from the U.S. Census Bureau. Compared to September 2020, new orders for Primary Metals recorded the highest increase, jumping 25.6 percent. Machinery followed with a 20.0 percent increase, while Fabricated Metal Products came in third, with orders posting an 18.7 percent improvement.
Every manufacturing industry recorded steady year-over-year increases in terms of new orders. As of September, only two sectors recorded single-digit upticks: Orders for Computers and Electronic Products were up by 6.4 percent, while orders for Furniture and Related Products recorded a 2.7 percent increase.
On a month-over-month basis, new orders increased by a modest 0.8 percent—equal to $4.2 million—as of September. Unlike the year-over-year climbs in new orders, the monthly changes fluctuated across every surveyed industry. The only sector to record a double-digit increase was Computers and Electronic Products, where orders jumped by 18.6 percent. Machinery followed with a 5.1 percent increase. Electrical Equipment, Appliances and Components and Durable Goods industries hovered above the 2 percent rate, with orders increasing by 2.6 and 2.2 percent, respectively.
Four industries recorded negative growth month-over-month as of September: New orders for Primary Metals were down by 0.2 percent, while Nondurable Goods Industries recorded a 0.6 percent decrease. New orders for Transportation Equipment were down by 1.0 percent, followed by Fabricated Metal Products (-1.8 percent).
—Posted on Nov. 22, 2021
Not seasonally adjusted; $ in millions
Source: U.S. Census Bureau
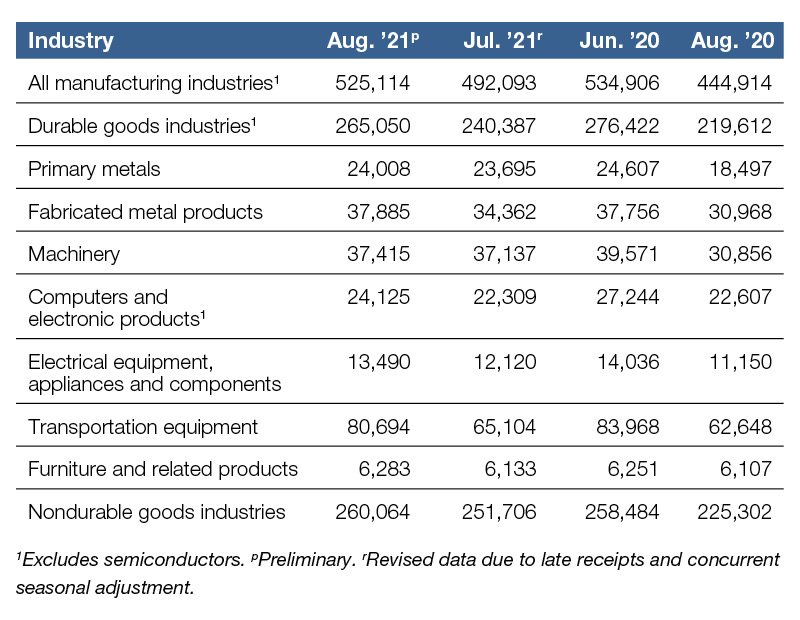
Year-over-year through August, new orders increased by an average of 15.3 percent, equal to $80.2 million, based on data from the U.S. Census Bureau. Compared to August 2020, new orders recorded the most significant uptick in the Primary Metals sectors, up by 23.0 percent. Transportation Equipment closely followed with a 22.4 percent climb as of August, while Fabricated Metal Products rounded out the top three, with orders up by 18.3 percent.
New orders have maintained a positive trajectory over recent months in terms of year-over-year evolution, even as certain industries showcased more tempered growth. As of August, only two sectors registered single-digit improvements: Orders for Computers and Electronic Products rose by 6.3 percent, while Furniture and Related Products clocked in with a 2.8 percent increase in new orders.
Month-over-month, new orders were up by an average of 6.7 percent—equal to $33 million—as of August. Consistent with the year-over-year trend, new orders increased for every surveyed industry. The most significant expansion came from Transportation Equipment, where orders climbed by 23.9 percent. Electrical Equipment, Appliances and Components followed with an 11.3 percent improvement. Orders in the Durable Goods Industries and Fabricated Metal Products sector registered the same growth rate, at 10.3 percent as of August.
Every other industry recorded single-digit upticks: Orders for Computers and Electronic Products were up by 8.1 percent, followed by the Nondurable Goods Industries (up 3.3 percent), Furniture and Related Products (up 2.4 percent), Primary Metals (up 1.3 percent) and Machinery (up 0.7 percent).
—Posted on Oct. 26, 2021
Not seasonally adjusted; $ in millions
Source: U.S. Census Bureau
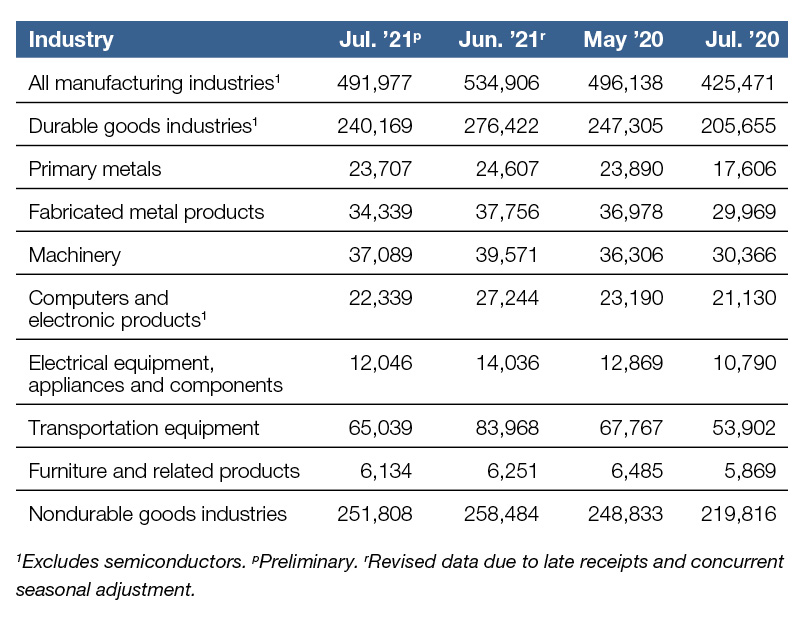
As of July, new orders increased on a year-over-year basis by an average of 15.6 percent, equal to $66.5 million, according to data from the U.S. Census Bureau. Compared to July 2020, the most significant expansion came from the Primary Metals sector, where new orders climbed by 34.7 percent. As the industrial sector continues to thrive, new orders were up by 22.1 percent for Machinery, followed by a 20.7 percent increase for Transportation Equipment.
Year-over-year, every surveyed manufacturing industry recorded steady—even if occasionally tempered—increases, a pattern that has steadily persisted throughout recent months. As of July, the most modest upticks came from two sectors, where the growth rate remained under the double-digit threshold—orders edged up by 5.7 percent for Computers and Electronic Products, and by 4.5 percent for Furniture and Related Products.
On a month-over-month basis, new orders fell by an average of 8.0 percent—equal to $42.9 million—as of July. In contrast with year-over-year trends, new orders decreased for every surveyed industry. The most notable drop came from Transportation Equipment, where orders fell by 22.5 percent. Computers and Electronic Products followed with an 18.0 percent decline, while orders for Electrical Equipment, Appliances and Components slid by 14.2 percent. Orders for Durable Goods Industries decreased by 13.1 percent.
Orders for every other industry recorded declines under double-digit levels—Fabricated Metal Products was down by 9.1 percent, while orders for Machinery fell by 6.3 percent, followed by Primary Metals (-3.7 percent), Nondurable Goods Industries (-2.6 percent), and Furniture and Related Products (-1.9 percent).
—Posted on Sep. 29, 2021
Not seasonally adjusted; $ in millions
Source: U.S. Census Bureau
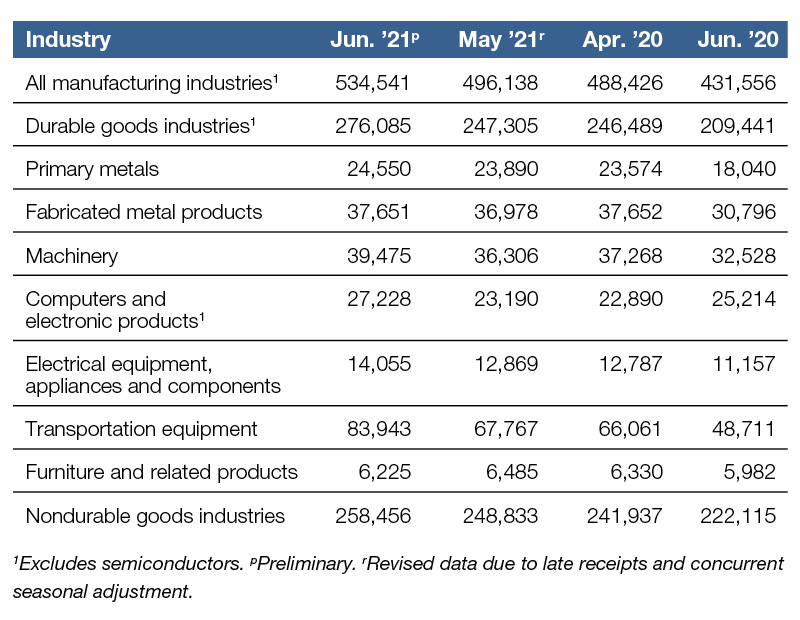
Year-over-year as of June, new orders increased by an average of 23.9 percent, equal to $103 million, according to data from the U.S. Census Bureau. Compared to June 2020, the most considerable change came from the Transportation Equipment sector, where new orders jumped by 72.3 percent. That growth rate is double the figure recorded over the same interval for Primary Metals, where new orders edged up by 36.1 percent. The Durable Goods Industries followed with a 31.8 percent increase.
Consistent with trends observed in recent months, every manufacturing industry recorded an improvement in new orders on a year-over-year basis. Two sectors posted more modest changes, under the 10 percent threshold. New orders for Computers and Electronic Products were up by 8.0 percent, while the smallest change came from Furniture and Related Products, up by 4.1 percent as of June.
On a month-over-month basis, new orders increased by an average of 7.7 percent—equal to $38.4 million—as of June. New orders were up for most industries, and, in line with year-over-year trends, Transportation Equipment led growth with a 23.9 percent uptick. Computers and Electronic Products followed with a 17.4 percent increase, while new orders for the Durable Goods Industries improved by 11.6 percent.
Every other manufacturing industry recorded one-digit upticks month-over-month, with the most modest changes coming from the Nondurable Goods Industries (up by 3.9 percent) and Fabricated Metal Products (up by 1.8 percent). The only sector to record a downtick in new orders month-over-month was Furniture and Related Products, down by 4.0 percent as of June.
—Posted on Aug. 30, 2021
Not seasonally adjusted; $ in millions
Source: U.S. Census Bureau
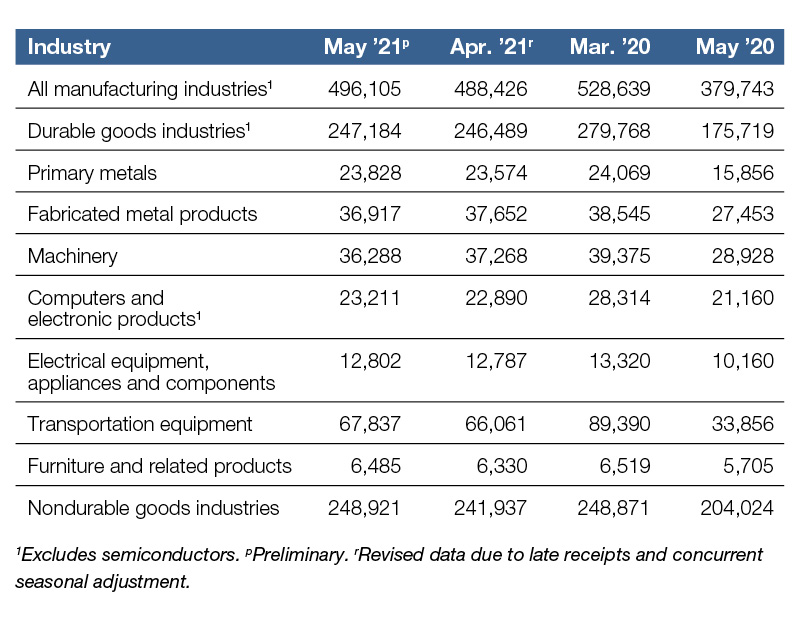
New orders increased year-over-year by an average of 30.6 percent—equal to $116.4 million—as of May, according to data from the U.S. Census Bureau. Compared to May 2020, new orders for Transportation Equipment climbed significantly, up by 100.4 percent. Primary Metals followed with a 50.3 percent increase, while new orders for the Durable Goods Industries posted a 40.7 percent improvement.
Overall, every manufacturing industry recorded upticks in new orders year-over-year. The smallest change again came from Computers and Electronic Products, up by 9.7 percent as of May. As was the case in April, Furniture and Related Products (up 13.7 percent) and the Nondurable Goods Industries (up by 22.0 percent) were also on the lower end of the spectrum.
On a month-over-month basis, new orders posted more modest increases, up by an average of 1.6 percent—equal to $7.7 million—as of May. Mostly in line with the year-over-year trend, orders improved in sectors including the Nondurable Goods Industries (up by 2.9 percent—the most notable change recorded as of May). Transportation Equipment followed with a 2.7 percent uptick, while orders for Furniture and Related Products increased by 2.4 percent.
The most modest upticks came from the Durable Goods Industries (up by 0.3 percent) and Electrical Equipment, Appliances and Components (up by 0.1 percent). Only two sectors recorded negative growth month-over-month as of May: New orders were down by 2.6 percent for Machinery, followed by a 2.0 percent slip for Fabricated Metal Products.
—Posted on Jul. 27, 2021
Not seasonally adjusted; $ in millions
Source: U.S. Census Bureau
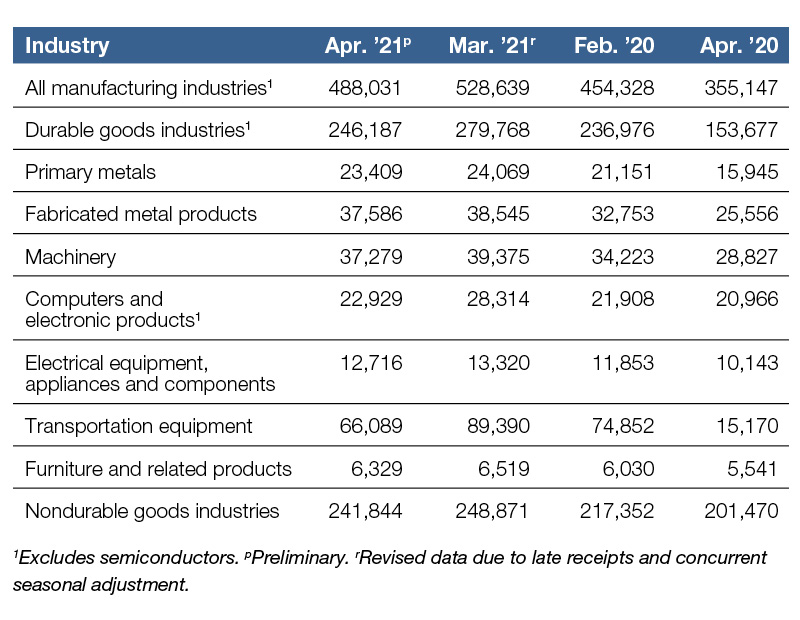
Year-over-year, new orders increased by an average 37.4 percent—or by $132.9 million—as of April, according to data from the U.S. Census Bureau. Compared to April 2020, new orders for Transportation Equipment recorded a robust improvement, up by 335.7 percent. The Durable Goods Industries followed with a 60.2 percent surge, while new orders for the Fabricated Metal Products industry recorded a 47.1 percent uptick.
Every manufacturing industry recorded year-over-year increases in new orders, with the most modest change coming from Computers and Electronic Products, up by 9.4 percent as of April. Furniture and Related Products (up 14.2 percent) and the Nondurable Goods Industries (up by 20.0 percent) were also on the lower end of the spectrum.
On a month-over-month basis, new orders fell by an average 7.7 percent as of April, accounting for a $40.6 million drop. In contrast with the year-over-year trend, new orders declined for every industry month-over-month, with Transportation Equipment orders registering the most notable slip, down 26.1 percent. Computers and Electronic Products followed with a 19.0 percent decline, while new orders for the Durable Goods Industries slid by 12.0 percent. The smallest change came from Fabricated Metal Products, down by just 2.5 percent as of April. Primary Metals (-2.7 percent), Nondurable Goods Industries (-2.8 percent) and Furniture and Related Products (-2.9 percent) were also above the -3.0 percent threshold.
—Posted on June 29, 2021
Not seasonally adjusted; $ in millions
Source: U.S. Census Bureau
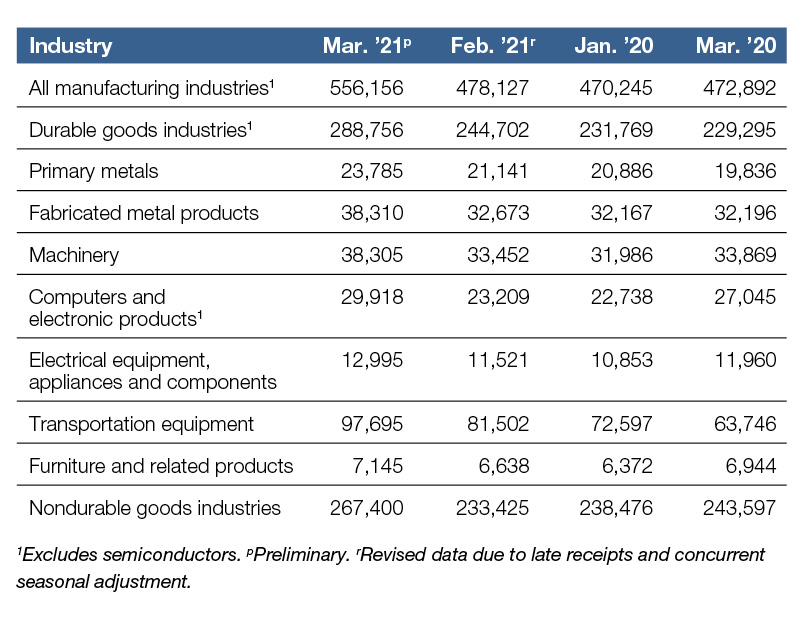
Year-over-year, new orders increased by an average 17.6 percent—or by $83.2 million—as of March, according to data from the U.S. Census Bureau. Compared to March 2020, new orders for Transportation Equipment recorded the most considerable improvement, up by 53.3 percent. The Durable Goods Industries followed with a 25.9 percent increase, while new orders for the Primary Metals industry registered a 19.9 percent uptick.
The most modest increase came from Furniture and Related Products, up by 2.9 percent as of March. Electrical Equipment, Appliances and Components were also on the lower end of the spectrum, with an 8.7 percent rise in new orders, followed by the Nondurable Goods Industries, up by 9.8 percent.
On a month-over-month basis, new orders edged up by an average 16.3 percent as of March, accounting for a $78 million increase. Consistent with the year-over-year trend, new orders surged for every industry, with Computers and Electronic Products leading growth (up by 28.9 percent). New orders performed well for Transportation Equipment month-over-month as well, up by 19.9 percent, followed by the Durable Goods Industries with an 18 percent uptick. As was the case in the year-over-year pattern, the smallest change came from Furniture and Related Products, up by 7.6 percent.
—Posted on May 28, 2021
Not seasonally adjusted; $ in millions
Source: U.S. Census Bureau
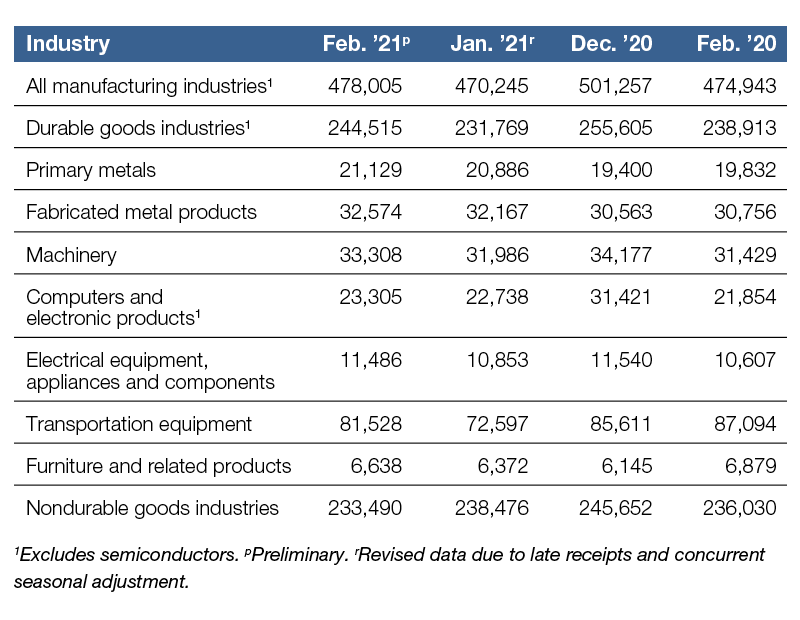
New orders increased year-over-year by an average 0.6 percent—or by $3.1 million—as of February, according to data from the U.S. Census Bureau. Compared to February 2020, new orders for Electrical Equipment, Appliances and Components registered the most significant increase, up by 8.3 percent, followed by Computer and Electronic Products, with a 6.6 percent jump in new orders and a 6.6 percent increase for Primary Metals. New orders for Machinery improved by 6.0 percent, while Fabricated Metal Products orders were up by 5.9 percent. The smallest positive change came form the Durable Goods industries, up by 2.3 percent.
As of February, new orders slid for three sectors, with Transportation Equipment orders falling by 6.4 percent, followed by Furniture and Related Products, which were down by 3.5 percent, and the Nondurable Goods Industries, where orders decreased by 1.1 percent.
On a month-over-month basis, new orders ticked up by an average 1.7 percent as of February, equal to a $7.8 million increase. Mostly in line with the year-over-year pattern, new orders rose for most industries, with one exception—orders for the Nondurable Goods industries slipped by 2.1 percent. On the other end of the spectrum, Transportation Equipment orders led growth as of February, up by 12.3 percent. Electrical Equipment, Appliances and Components followed with a 5.8 percent uptick, while orders for the Durable Goods industries improved by 5.5 percent, Furniture and Related Products orders were up by 4.2 percent and Machinery orders increased by 4.1 percent.
—Posted on April 23, 2021
Not seasonally adjusted; $ in millions
Source: U.S. Census Bureau
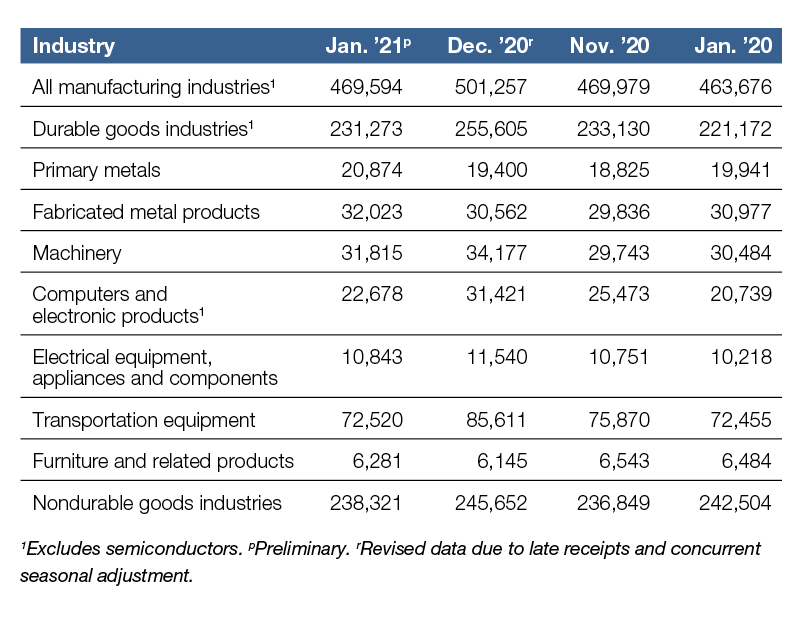
Year-over-year, new orders increased by an average 1.3 percent—or by $5.9 million—as of January, according to data from the U.S. Census Bureau. Compared to January 2021, new orders for Computer and Electronic Products recorded the most considerable increase, up by 9.3 percent, followed by Electrical Equipment, Appliances and Components (6.1 percent) and Primary Metals (4.7 percent).
Orders for the Durable Goods Industries were up by 4.6 percent, while orders for Machinery rose 4.4 percent, followed by Fabricated Metal Products (up by 3.4 percent). Transportation Equipment registered the smallest growth, with orders up by just 0.1 percent. As of January, new orders fell for two sectors: Furniture and Related Products (down by 3.1 percent) and Nondurable Goods Industries (down by 1.7 percent).
On a month-over-month basis, new orders decreased by an average 6.3 percent as of January, equal to a $31.7 million drop. As opposed to the year-over-year trend, new orders were down for most industries, with the most notable decrease coming from the Computer and Electronic Products sector (-27.8 percent), followed by Transportation Equipment (-15.3 percent) and the Durable Goods Industries (-9.5 percent). Machinery recorded a 6.9 percent slip in new orders, while Electrical Equipment, Appliances and Components were down by 6.0 percent, followed by the Nondurable Goods Industries (-3.0 percent).
The only sectors to post gains month-over-month were Primary Metals (7.6 percent), Fabricated Metal Products (4.8 percent) and Furniture and Related Products (2.2 percent).
—Posted on March 25, 2021


You must be logged in to post a comment.