
From R&D facilities to manufacturing plants and the distribution chain, industrial real estate is essential in a world defined by high-tech production and same-day delivery. As such, industrial real estate is being touted as one of commercial real estate’s bastions of stability amid the ongoing turmoil. However, the industry today looks nothing like it did 20 or 70 years ago.
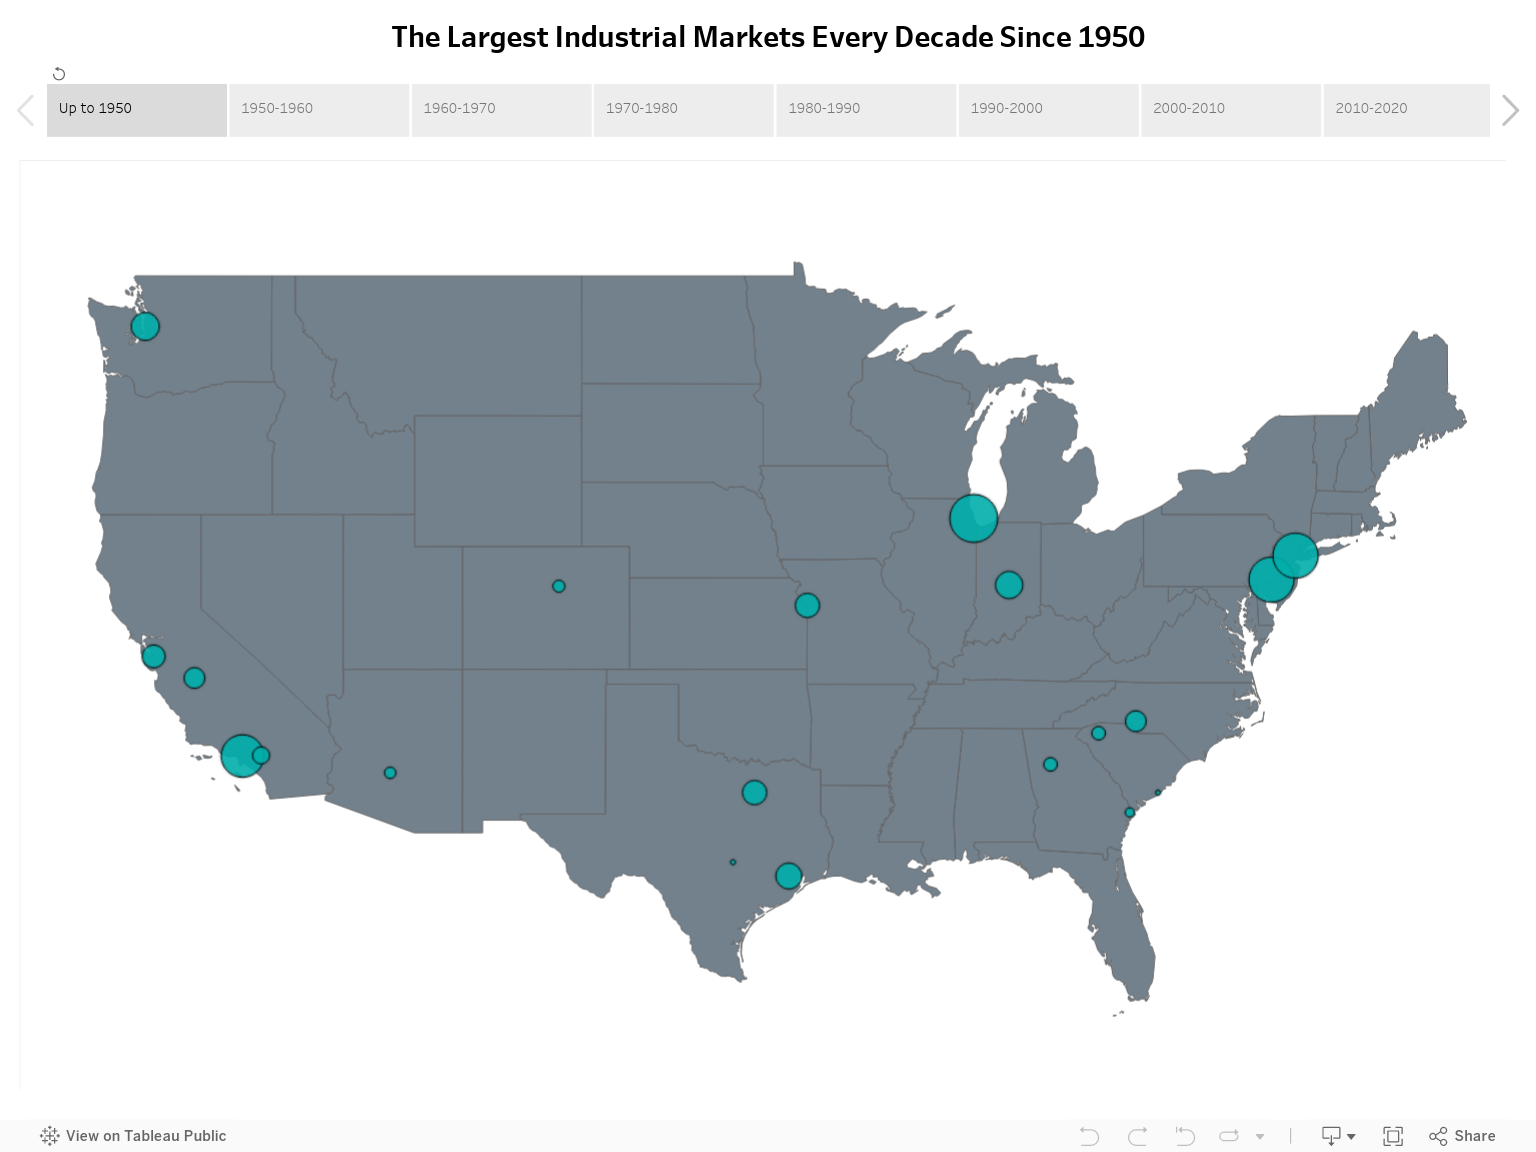
With that in mind, we looked at industrial real estate development since the 1950s, which was as far back as the data allowed. Specifically, we identified the largest U.S. industrial markets for each decade; which cities have been home to the most development; and what the industrial space race looks like for the near future across the map.
Executive Summary
- Chicagoland was the largest U.S. industrial market for the majority of the last 70 years — a title it still holds today.
- Industrial development since 1950 has favored the metros with the most room to sprawl, with select California and Texas markets racing to catch up with Chicago.
- Accelerated industrial expansion in Dallas may see it overtaking Chicago in inventory in the coming years.
- Los Angeles was still in the top three, despite development consistently dropping since the 1970s.
- Inland Empire, Calif., shot up to become the fourth-largest industrial market in the span of less than 20 years.
- Northern New Jersey, Houston, and Atlanta were neck and neck for the fifth-largest U.S. industrial market in 2020.
Then & Now: Industrial Development Race Has Chicago Holding #1 Spot; Recent Growth Spurt Pushes Dallas Ahead of Saturated LA
In 1950, the heaviest weight of the U.S. industrial market was concentrated in a handful of markets. Specifically, industrial space in Chicago amounted to roughly 88 million square feet for the largest industrial real estate market in the country. Meanwhile, Philadelphia was second-largest with nearly 79 million square feet of industrial property, while northern New Jersey — home to 75 million square feet — was a close third.
At the same time, on the West Coast, Los Angeles had grown to nearly 70 million square feet of industrial space. While it was fourth-largest in the country at the time, it was far ahead of any other major industrial hub in both the Western U.S. and Southern U.S. regions.
Seven decades later, Chicago still remains in the lead, although geography has played a significant role in shifting development trends across the rest of the country: Since the 1950s, fortune has favored the metros with the most room to sprawl, as the competition has intensified to quench the ever-increasing demand for industrial space. Consequently, sizeable California and Texas markets now race to both meet and anticipate the fulfillment and logistical needs of our fast-paced consumer landscape.
To that end, the biggest ranking upset saw Dallas overtake Los Angeles as Chicago’s main contender in the decade following 2010. More precisely, industrial development in the Texas metroplex accelerated significantly during the last 20 years and has been consistently ramping up since then — with no signs of slowing down anytime soon.
Meanwhile, as development in the Los Angeles market tightened following its highest mark in the 1970s and 1980s, the Inland Empire, Calif., shot up from outside the top 10 to become the fourth-largest market in the country today: In fact, in fewer than 20 years, it became one of the hottest industrial real estate markets in the country with some of the consistently lowest vacancies in the U.S., although southern California’s developable land woes may start affecting supply here, as well.
Back on the East Coast, northern New Jersey slipped to fifth place, and current pipeline estimates show that Houston is poised to soon take its place, with Atlanta also expanding very close behind. Read on for more detailed findings on the evolution of the country’s key industrial real estate markets since 1950, as well as the near-future outlook for each.
Chicagoland Holds on to Title of Largest Industrial Market, Exceeding 1 Billion Square Feet of Inventory
- Chicago was the largest industrial real estate market for much of the last seven decades, and was projected to add a total of 57 million square feet of space between 2020 and the end of 2023.
- Chicago’s largest inventory growth occurred between 1991 and 2000, when 165 million square feet of space was added to the market.
At least for the foreseeable future, current projections estimate that Chicago will hold on to its crown as largest in the nation. However, this is nothing new: With the exception of the 1970s and 80s, the Windy City has consistently had the largest industrial stock inventory as far back as our estimates go in 1950.
Notably, our study’s methodology only considered properties exceeding 25,000 square feet of industrial space, thereby placing Chicago’s inventory just under 1 billion square feet. That said, with the addition of the smaller properties, as well as recent developments, it’s likely that the market has already surpassed the 1-billion-square-foot mark, in which case it would be the first market in the nation to do so. As such, the Chicago market now represents just over 5% of national stock which currently stands around 18.3 billion square feet.
Despite being among the cities that were hit the hardest by the Great Depression, Chicago’s economy swiftly recovered and industrial real estate development followed suit. As a result, Chicago’s steel mills, warehouses and other industrial properties totaled 88 million square feet of industrial space in 1950 — already the largest inventory in the nation at the time.
Then, after nearly doubling in size in the 1950s, Chicago continued adding more than 100 million square feet of space each decade until today, consistently remaining among the markets to add the most new industrial stock and ensuring its place at the top of the current ranking. Namely, the 1990s saw the most new industrial space added to the metro with 165 million square feet, dropping slightly to 160 million in the aughts and then declining further to 137 million in the 2010s.
Nowadays, the metro’s once-defining steel industry is just one piece of its complex economic puzzle. Continuing a trend that started in the 1960s and 70s, manufacturing companies in the metro either went out of business or consolidated, and institutional investors replaced individual owners. Accordingly, there were 25,500 companies operating in the manufacturing sector in Chicago in the year 2000, whereas that number dropped to a little more than 20,000 in 2010 and 17,700 in 2020.

Historically, warehouse and bulk distribution were the industrial property types drawing the most investment. A lot of the industrial buildings were owned by individuals and smaller companies. But over the years, institutional investors have come in and bought these buildings.
– David R. Dunn, Strategic Real Estate Advisor, Real Estate Bees
In addition to industries like finance, insurance, and modern manufacturing, the transportation, logistics and distribution sectors arguably form the city’s economic backbone: Employment in warehousing and storage increased almost tenfold between 2000 and 2020 — a trend likely to continue given the significance of e-commerce and the growing availability of next- and same-day delivery.

There has been a considerable growth in last-mile delivery warehouses and in bringing distribution centers closer to population centers. Historically, one of the major innovations that has affected industrial real estate in particular has been with the introduction and innovation in concrete tilt-up construction. Large scale concrete tilt-up construction buildings are generally cheaper and much quicker to build than concrete block, steel frame, or wood-frame buildings.
– Russ Moroz, Director, National Office & Industrial Properties Group, Marcus & Millichap
DFW Hot on Chicago’s Heels as Industrial Development in Metroplex Accelerates
- Dallas-Fort Worth’s industrial stock is projected to stand at 878 million square feet at the end of the year, making it the second-largest market nationally.
- The DFW industrial market added 190 million square feet between 2011 and 2020 — the largest amount nationwide and 50 million square feet more than Chicago.
- Most of Dallas’ industrial development took place since the turn of the millennium, with the market’s inventory growing by 67% in the last 20 years.
While Chicago is still the top dog in terms of total industrial square footage, Dallas-Fort Worth’s meteoric rise as a logistical and manufacturing hub may provide the first change to the status quo in three decades.
After adding a record-setting 190 million square foot of industrial space in the 2010s — the most inventory added by any market across all decades — as well as a further 70 million projected for 2020 to 2023, DFW’s total industrial stock is expected to stand at 878 million square feet at the end of 2023, making it the second-largest market nationally. While that’s still more than 100 million square feet shy of Chicago’s expected total at the end of this year, the metroplex nevertheless outpaced all other markets in new industrial properties for three years in a row, meaning it’s steadily catching up.
Moreover, DFW’s accelerated growth occurred primarily during the last two decades: While the market boasted 484 million square feet of inventory at the turn of the millennium, that figure had increased by 67% in the span of just 20 years — and that’s likely to continue. Additionally, the sprawling metro has the largest availability of vacant land in the nation; ever-growing storage and logistical needs; and a high-tech manufacturing landscape that stands to be further supported by reshoring.

For several years, big-box industrial product took center stage as e-commerce users like Amazon voraciously took spaces of 500,000 to 1 million square feet or more. The sector also attracted investors because the companies filling those spaces were thought to have a higher tenant creditworthiness. The substantial size of those investments also allowed investors to deploy large amounts of capital quickly.
Coming out of the pandemic, however, we’ve seen a drastic shift in the industrial market. Global events and supply chain issues led to a dramatic push toward ‘onshoring’ by businesses looking to relieve pressure on distribution channels. This swing caused a spike in demand for large warehouse spaces, leading to a boom in new development.
– Chris Evans, Director of Portfolio Management, BKM Capital Partners
LA Retains Title as 3rd-Largest Industrial Market, Even as Development Drops Since 1970s
- Los Angeles was the largest industrial real estate market in the 1970s and 1980s, later being surpassed by Chicago and Dallas.
- The largest addition to the market (and the largest nationally) took place in the 1970s, when 150 million square feet of space was delivered.
- Since then, LA industrial development has tapered off, dropping to 65 million square feet in the 1990s and 2000s and eventually just 37 million in the 2010s.
In the decades after World War II, Los Angeles kept up with Chicago’s industrial space output, delivering more than 100 million square feet of space per decade between 1960 and 1990. As a matter of fact, for two decades between 1970 and 1990, Los Angeles surpassed Chicago in total industrial space and became the nation’s largest market.
However, a plethora of causes — ranging from a lack of developable land in key logistical areas to rising development costs — have since caused deliveries in the metro to gradually taper off: After delivering a record-breaking 150 million square feet of industrial real estate in the 1970s, development dropped to 112 million in the 80s and 67 million in the 90s. Then, between 2011 and 2020, the market saw just 37 million square feet of industrial stock added — exacerbating supply issues in a market with historically low vacancies.
Home to the largest port in the Americas, it should come as no surprise that Los Angeles was consistently on the podium of largest markets by industrial inventory. As such, the LA industrial market will comprise an estimated 696 million square feet of space by the end of the year, making it the third-largest nationally.
Here, the massive flow of shipping means that warehouse space is as essential as it is hard to access in key logistical routes in the metro. At the same time, LA’s sizable manufacturing, biotech, and movie industries also drive demand for other types of industrial space, such as light and heavy manufacturing; R&D; and movie studios. Interestingly, Los Angeles has more employees working in industries that rely on industrial space to do business than any other U.S. metro, further highlighting LA’s appetite for new supply, which has gradually become harder to come by.

Warehousing and Distribution will continue to be the key players in our consumer-driven economy, but a combination of onshoring and a drive to manufacture more and more semi-conductors and chips in the USA will draw a tremendous amount of capital and investment in the immediate future.
– Rick Medinis, President of Industrial, NAI Robert Lynn
Elsewhere in California, industrial markets such as the Bay Area and the Central Valley (stretching from Redding in the north to Bakersfield in the south) feature smaller total inventories of around 300 million square feet, as well as lower rates of deliveries. For example, the Bay Area had 26 million square feet of industrial space built between 2011 and 2020. Granted, the slower pace of new development is less of an issue here, where the region isn’t as reliant on logistics as southern California.
Inland Empire Development Picks Up as LA Runs Out of Developable Space
- In 2000, Inland Empire, Calif., was the ninth-largest industrial market in the U.S. at 236 million total square feet.
- Since then, the market has grown 150% to 584 million square feet and now claims the nation’s fourth-largest industrial inventory.
As new industrial space in Los Angeles dwindled, secondary markets around it picked up the slack. The foremost of these markets is the Inland Empire, which encompasses parts of Riverside and San Bernardino counties and now stands as the fourth-largest industrial market in the U.S., ahead of entries such as Houston and northern New Jersey.
In 1980, the Inland Empire industrial market encompassed just 50 million square feet in all — one-third of what neighboring Los Angeles had seen built in just a decade. However, the market has since grown at a rapid pace, adding almost 200 million square feet of new space between then and the turn of the millennium. Then, another 175 million square feet was built here in the 2000s — the largest amount added by any market in that decade. And, 172 million square feet more was added in the 2010s — more than doubling the market’s inventory in the span of just two decades and turning the Inland Empire into one of California’s foremost logistical nodes and warehousing markets.

The biggest demand generator for industrial was the COVID supply chain bottleneck. Delivery failures affected manufacturers because their raw materials weren’t reaching them. In the height of the supply chain nightmare (when Port of Los Angeles videos ruled the internet), manufacturing timelines were pushed back by as many as six months, construction slowed — and, in some cases, stalled — because someone had to wait 14 months for half a dozen HVAC units. Just-in-time manufacturing delivery failed and finished consumer goods deliveries were delayed in ports awaiting ground transport. All this drove third-party logistics companies, builders, developers, manufacturers, everyone to seek warehouses to future-proof their supply chain.
– Kristin Geenty, President & COO, The Geenty Group Realtors
However, new development has plateaued in the ensuing years as area developers ran into similar issues as those faced by Los Angeles. Even so, an estimated 37 million square feet is expected to be completed between 2020 and 2023 in the Inland Empire (just more than half of Dallas-Fort Worth deliveries in the same period). All things considered, infill space may continue to provide the industrial land necessary for the Inland Empire market to keep growing, but companies looking to enhance their logistics in southern California may eventually have to look even further.
Northern New Jersey, Houston & Atlanta in Close Race for 5th Place This Decade
- Northern New Jersey was the third-largest industrial market in the U.S. between 1950 and 1990, behind Chicago and Los Angeles.
- Since then, the market was surpassed by Dallas and Inland Empire, Calif., encompassing a projected 550 million square feet of space at the end of 2023.
- After slowing development between 1980 and 2009, the 2010s saw 120 million square feet of space added to the Houston industrial market — the most in the city’s history.
- Industrial space in Atlanta is projected to approach 540 million square feet by the end of 2023 — within reach of pushing northern New Jersey further down in the top 10 by the end of the decade.
Northern New Jersey began as the third-largest industrial market in the U.S. in the earliest period of our study, and it still stands as one of the foremost warehousing and distribution centers on the East Coast. Yet, after nearly keeping pace with Chicago and Los Angeles in the past, new development here hovered around 50 million square feet of industrial stock per decade since the 1980s, thereby keeping supply steady, but lagging behind other markets of similar size.
In 2020, the market was still narrowly ahead of Houston in inventory and stood out for being home to the largest number of companies requiring industrial real estate to operate between 2000 and 2020. But, projections for the end of the year have Space City surpassing northern New Jersey by 5 million square feet and dropping it further down the list of the 10 largest markets in the country.
Turning to Houston, the market’s industrial growth parallels that of Dallas, albeit to a slightly lesser scale: Development spiked in the 1970s with more than 100 million square feet of new industrial space, but dipped in the following three decades. Then, as demand for transportation and logistics increased across the Lone Star State, Houston reached a new high in the 2010s with 120 million square feet of new developments. Yet, despite this considerable construction spike, Houston still trails DFW and the Inland Empire.
Further east and with 25.5 million square feet of industrial space scheduled for delivery between 2020 and 2023, Atlanta is another market that may surpass northern New Jersey in industrial inventory in the coming years. In fact, pipeline estimates expect the market to reach nearly 540 million square feet by the end of 2023 — 10 million square feet behind estimated New Jersey totals for the end of year.
In this case, Atlanta’s heyday of industrial development was in the 1990s, when 118 million square feet of inventory was built in the metro. Though development has been more muted since then with around 80 million square feet per decade, output here is still comparable to other growing logistical hubs in the South, such as those in Texas.
Meanwhile, among the currently smaller rising stars, Austin, Texas, is expected to surpass the 100-million-square-foot mark for total inventory by the end of the year. More precisely, it’s estimated to add more than 18.5 million square feet of space between 2020 and 2023 — more than the 16 million square feet added during the 2010s. What’s more, the number of manufacturing companies here increased by 17% in the last decade — the largest such growth among all entries on the list — while the number of other warehouse-using industries (such as wholesale and rental and leasing companies) also spiked.
Finally, notable mentions outside of the top five also included Philadelphia: From its initial status as the second-largest in the 1950s, the city has remained in eighth place since the early 2000s, when the Inland Empire surpassed it in the ranking. It’s worth noting here that Philadelphia’s industrial real estate market added 35 million square feet of space in the 2010s — a growth rate comparable to that of northern New Jersey — and is expected to reach about 420 million square feet this year.
The interactive map below offers an overview of development in the largest U.S. industrial real estate markets for each decade since 1950, as well as projected growth through to the end of 2023.
Methodology
For this study, we analyzed the progression of the 20 most important industrial real estate markets in the U.S. between 1950 and 2023 using data provided by CommercialEdge. All 2023 square footage data mentioned in the study includes industrial properties scheduled to be completed by December 31, 2023. The study only included industrial properties totaling more than 25,000 square feet of space.
The numbers of establishments and workers operating in specific industries were extracted from the latest CBP data. References to “industries reliant on industrial real estate” referred to the following NAICS codes:
- Manufacturing (31-33)
- Wholesale Trade (42)
- Building Material and Supplies Dealers (4441)
- Furniture and Home Furnishings Retailers (4491)
- Warehouse Clubs, Supercenters and Other General Merchandise Retailers (4552)
- Warehousing and Storage (4931)
- Motion Picture and Video Production (512110)
- Teleproduction and Other Postproduction Services (512191)
- Radio and Television Broadcast Stations (5161)
- Computing Infrastructure Providers, Data Processing, Web Hosting and Related Services (5182)
- Lessors of Mini Warehouses and Self-Storage Units (531130)
- Lessors of Other Real Estate Property (531190)
- Automotive Repair and Maintenance (8111)
- Commercial and Industrial Machinery and Equipment (except Automotive and Electronic) Repair and Maintenance (8113)
While every effort was made to ensure the timeliness and accuracy of the information presented herein, the information is provided “as is” and neither CommercialSearch nor CommercialEdge can guarantee that the information provided is complete. This report is for general informational purposes only. It does not constitute and should not be relied upon as a basis for any investment decision. The information presented is subject to change without notice and may or may not apply depending on the circumstances. Always contact a qualified investment consultant if you need advice regarding buying, selling or otherwise transacting in any investment.