
According to a report by the National Association of Colleges and Employers (NACE), businesses are projected to hire 15% more new college graduates from the Class of 2023 than they did from the Class of 2022, creating a favorable moment for those looking to kickstart their career. Add to that the fact that, since the pandemic, workers have been more willing to look for new opportunities and change course by learning new skills — and you have a very dynamic picture of the labor market for the upcoming years.
So, to better understand which urban areas were best positioned to provide opportunities for top talent, we compiled a ranking of the top 30 U.S. metropolitan statistical areas (MSAs) for job opportunities. Points were awarded across 10 metrics that were split into two broad categories — 1) education, which included data on average graduation rates, student-to-teacher ratio and the quality of universities within each metro area, and 2) labor market conditions, including job mobility, percentage of high-skill jobs and unemployment rates.
For more information on definitions, data sources, and point allocation, visit our methodology, and keep reading for more of our findings on the best metros for job opportunities.
Western Metros Make Up 1/3 of the Ranking – San Jose, Calif.; Trenton, N.J.; & Boston Secure Top 3
Western metro areas stood out with 10 entries making the final list, and nearly half of these were from California: San Jose, San Francisco, Los Angeles and Santa Maria-Santa Barbara. The runners-up were the South and Northeastern metros with nine and seven entries, respectively.
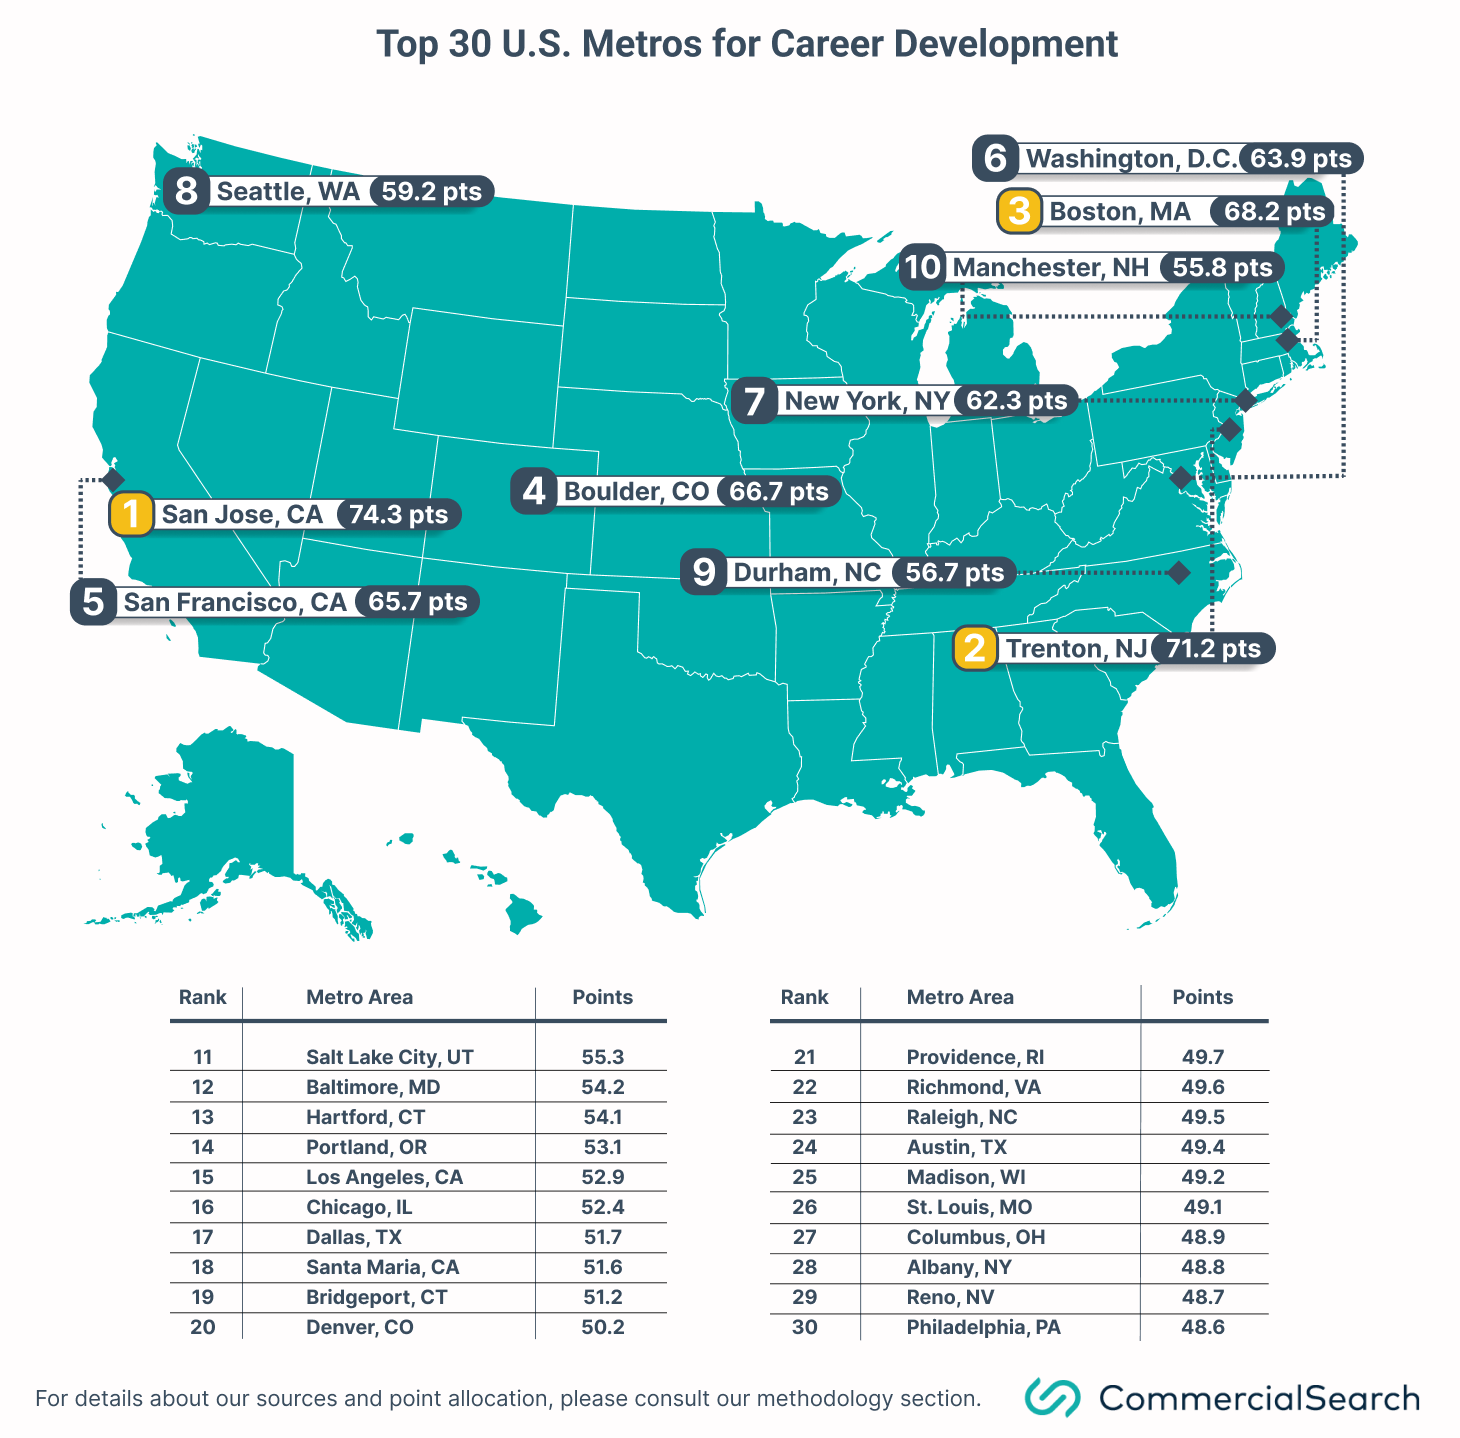
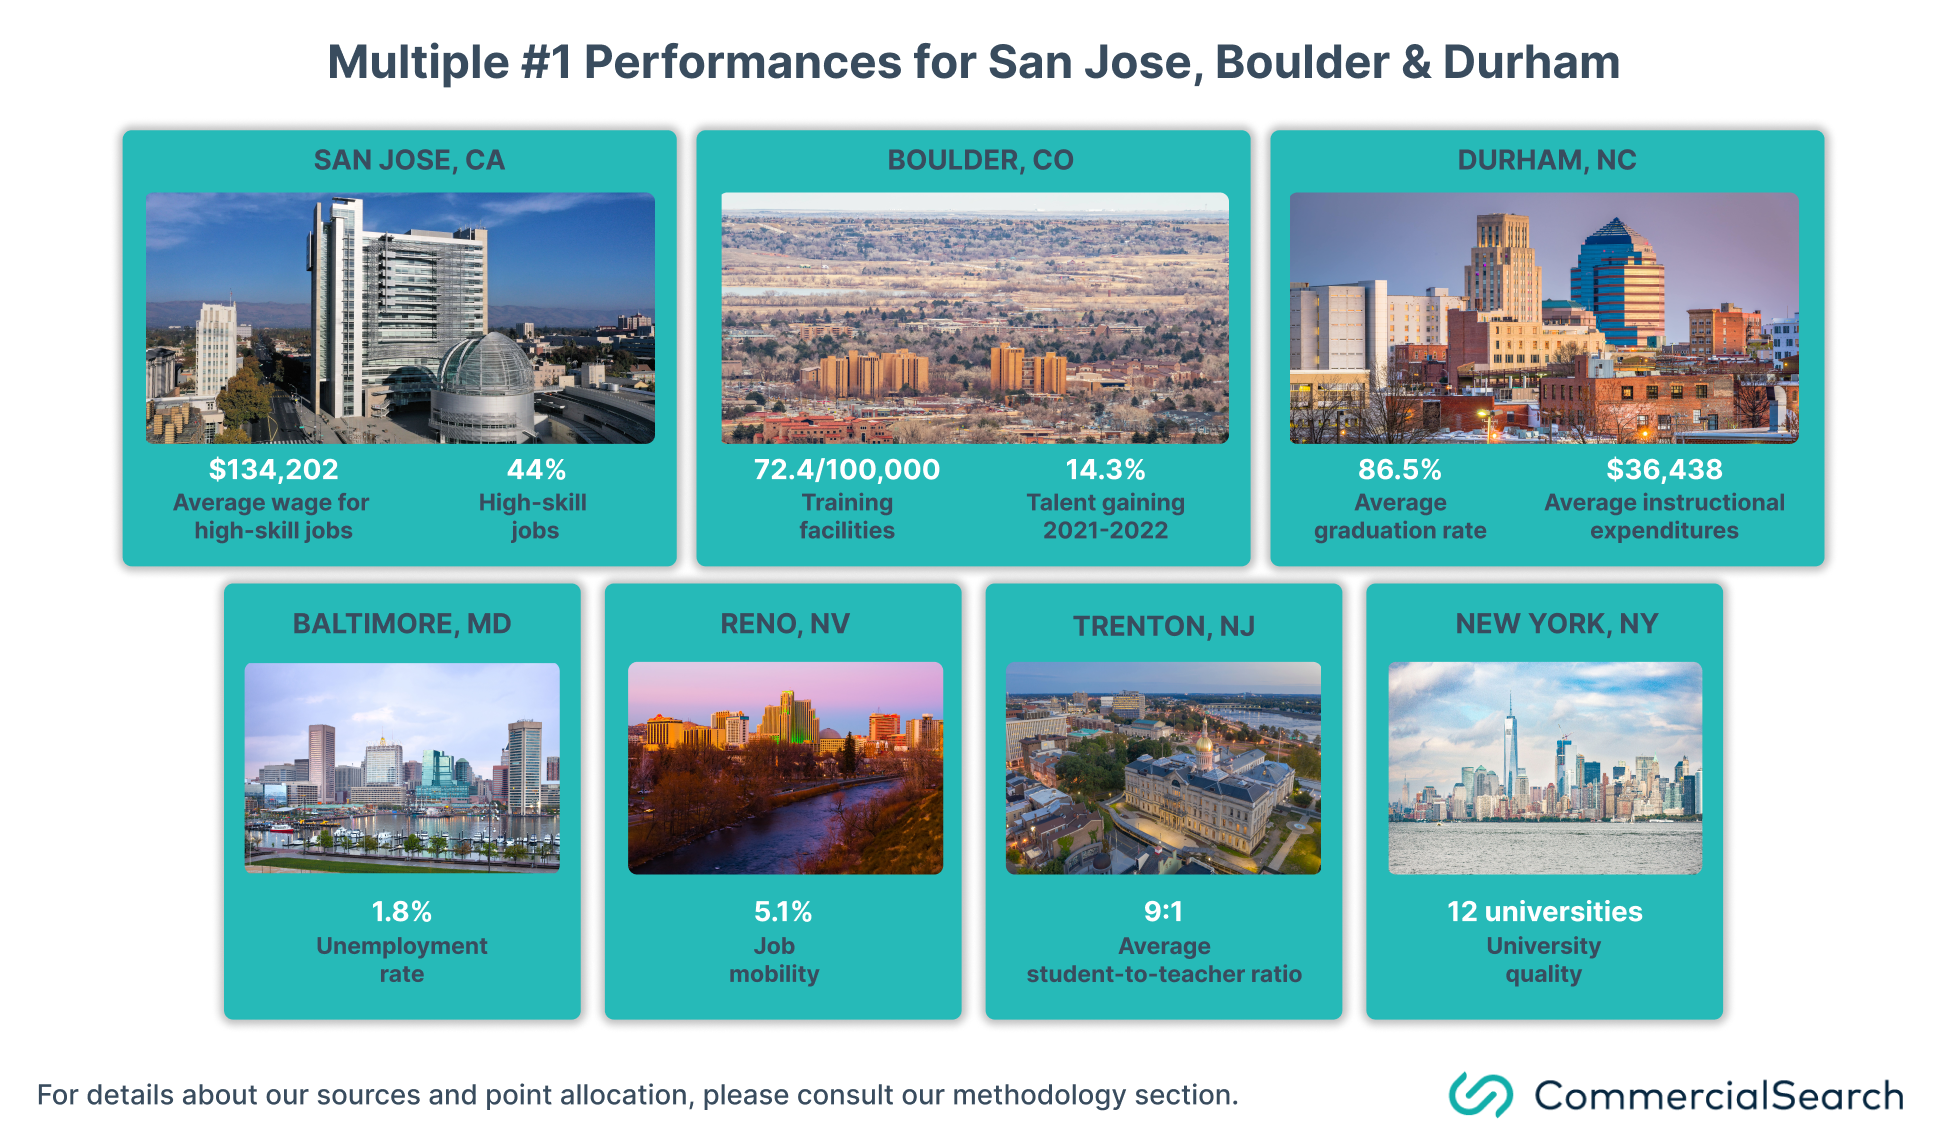
San Jose, Calif., cemented this Western domination by topping the ranking with a total of 74 points. The California metro area earned the highest accolades for the largest percentage of high-skill jobs, as well as the highest median wages for these occupations.
Next, the Trenton, N.J., metro secured second place by racking up 71 points and boasting the best student-to-teacher ratio on the list. In addition, Trenton-Princeton, N.J., also put together a couple of second-place finishes for its average graduation rate, as well as its share of training facilities per 100,000 residents.
To complete the podium, Boston gathered 68 points with top-five finishes for its average graduation rate, percentage of jobs requiring a higher qualification and the corresponding yearly median wage. In addition, the Massachusetts metropolitan area also had the second-highest number of top universities within its bounds, including Boston University and Northeastern University.
However, performances across individual metrics were not solely dominated by the cities that raked in the highest number of points. In fact, there were a couple of entries outside of the top three that also boasted several top-level finishes, such as Boulder, Colo., and Durham, N.C.
To that end and in fourth place with 67 points, Boulder, Colo., headed the list for its share of training facilities and percentage of high-qualified jobs gained between 2021 and 2022. Meanwhile, the Durham, N.C., metro — which ranked 9th overall — aced the average graduation rate and instructional expenditure per student categories.
Unsurprisingly, the New York metropolitan area is home to more top-ranked universities than any other entry with an illustrious list that includes the likes of Columbia, Cornell and New York University. Accordingly, the New York metro is also a powerful magnet for professionals looking for high-quality jobs as it rewards top talent with some of the highest median salaries in that category ($126,287 per year), outranked only by San Jose, Calif., and San Francisco. Even so, these performances were followed by average showings across the remaining indicators, eventually leading to a 7th place finish for the Big Apple.
Next, Seattle secured its spot within the upper half of the ranking despite not recording any top-five finishes across any of the metrics included in the study. Rather, its best showings were for job mobility and the number of available training facilities, for which it ranked 6th and 7th, respectively.
Then, as the highest-ranking among those from the Midwest that made it into the top 30, Chicago picked up a total of 52 points. That earned it a 16th-place finish, nestled between Los Angeles and Dallas.
New York & Boston Head-and-Shoulders Above Competition for Most Highly Rated Universities
Using data collected by EduRank, we assessed the quality of educational institutions within U.S. metropolitan areas. Entries were awarded points for the number of local universities that made it into the aggregator’s nationwide top 250 hubs of higher learning. The resulting ranking holds few surprises, especially at the higher end, where Ivy League colleges located within the area played a great role in the final score.
In first place, the New York metro collected the maximum number of points allocated for this metric, while Boston’s solid reputation as an engineering and robotics research hub — along with its emphasis on biology and advances in biomedical engineering —earned it a second-place finish. Both Northeastern metros outperformed their competitors significantly for this indicator.
The top 10 list also included three Southern entries with Washington, D.C. as the highest-ranking among them in third place. Meanwhile Dallas — the home of the University of Texas at Dallas — finished in sixth place on the university quality index, while Baltimore ranked eighth. Not to be outdone, the Midwest was represented by Chicago, which tied for fourth place with Los Angeles.
Despite putting up remarkable performances across several educational metrics, smaller metro areas — such as Trenton-Princeton, N.J., and Boulder, Colo. — were at a disadvantage here. Each hosted just one higher-learning institution included in EduRank’s nationwide ranking (Princeton and University of Colorado Boulder, respectively).
Durham Bets Big on Developing Talent With Highest Spending per Student & Best Graduation Rates
According to the National Student Clearinghouse Research Center, the average six-year U.S. college graduation rate in 2022 was about 64%. That said, Durham, N.C. — which topped the list both in terms of graduation rates, as well as the amount of money spent on each student for educational purposes — exceeded the national average by 23%. No doubt, investing in its students has been a major contributor to the North Carolina metro’s academic success as its $36,438 yearly expenditure per full-time student was nearly $5,500 above runner-up San Jose, Calif.’s numbers.
Of course, graduation success is not solely dependent on how much universities spend on their students. Other factors — such as access to a strong support system or a positive campus environment — can also influence academic performance.
Case in point: In nearly half of the metropolitan areas we ranked, graduation rates outperformed instructional expenditure levels. For instance, Madison, Wis., had an annual expenditure of $13,233 per student (12th for this metric), while its average graduation rate of 77% landed it in 4th place. Another example was that of the Santa Maria-Santa Barbara, Calif., metro area, which ranked third for average graduation rates, despite spending roughly one-third ($11,884 per year) of what both Trenton, N.J., and Durham, N.C., did.
Trenton, N.J., Has Best Student-to-Teacher Ratio Among Top 30 Metros
The student-teacher ratio is another vital metric for the assessment of the teaching staff’s workload and how available they are to offer support for their students. More precisely, a lower ratio is especially beneficial in the teaching of subjects such as physics, mathematics and chemistry.
Unsurprisingly, universities within the Trenton-Princeton, N.J., metro area with a strong focus on STEM topped this list. With a 9:1 student-to-faculty-ratio, the Trenton metro outperformed other Ivy League-hosting metro areas, such as Boston (#3); Providence, R.I. (#8); or New York (#22).
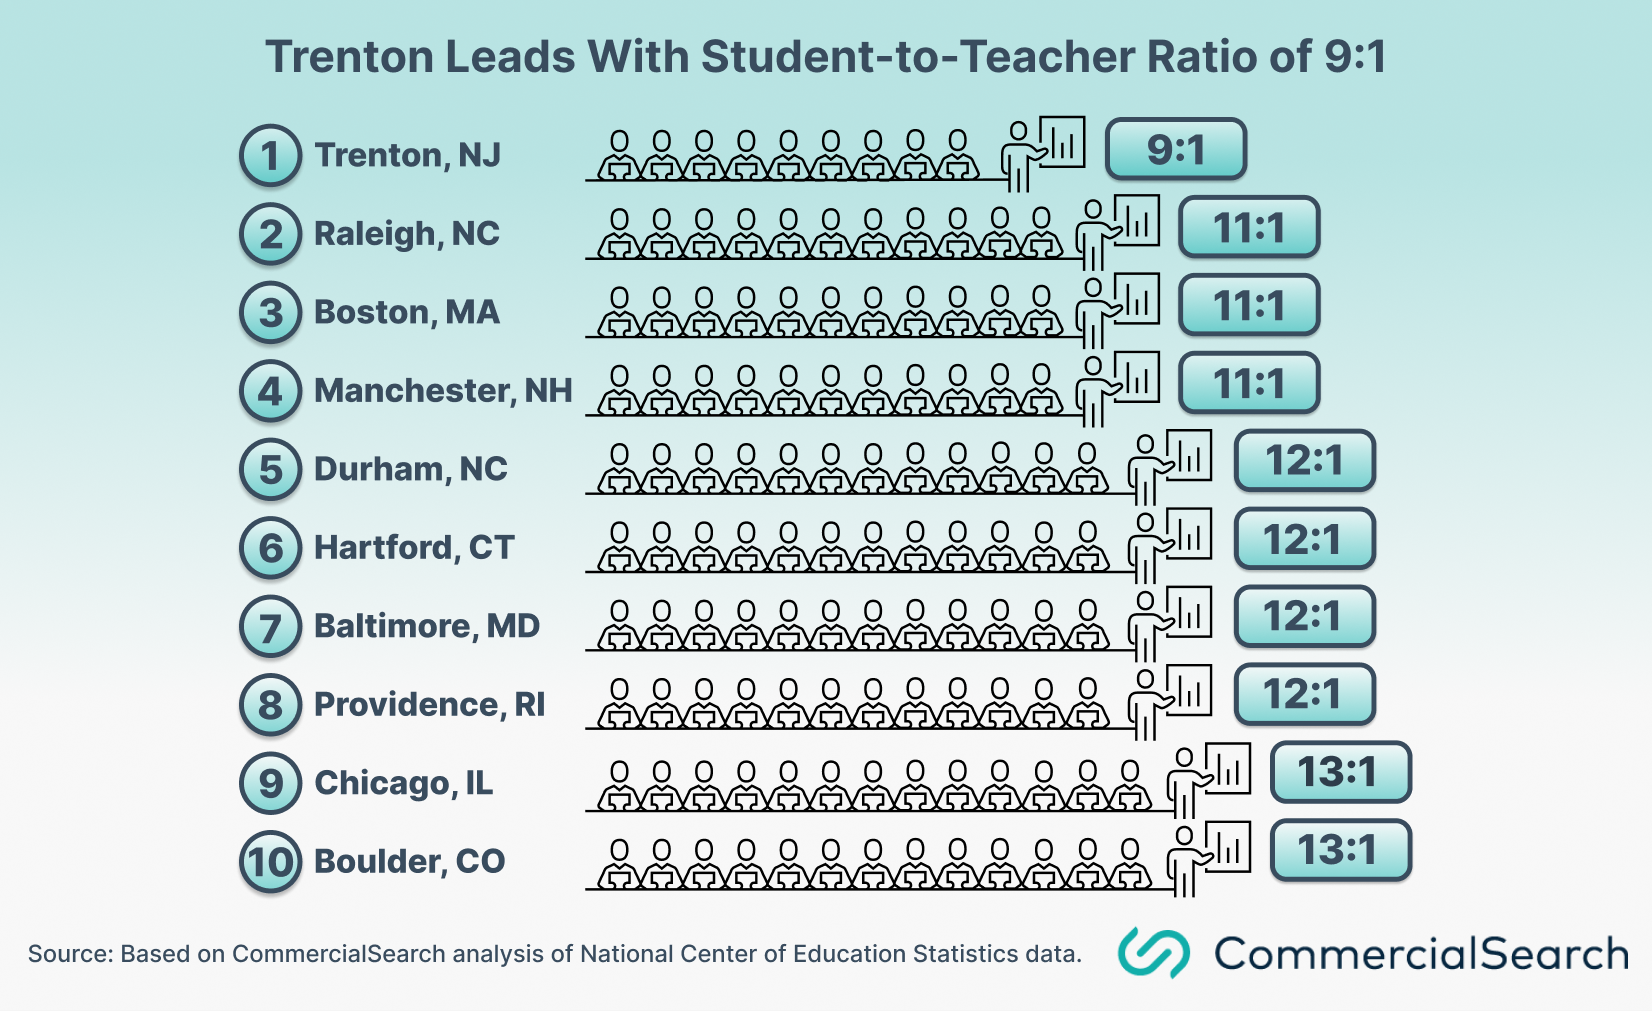
Similarly, competition was intense within the North Carolina Research Triangle, but the Raleigh metro came out on top: With an 11:1 student-to-teacher ratio, it earned second place, ahead of Durham at #5.
In this case, larger metro areas that attract more students are at a disadvantage, despite the relatively small gap in ratios. For instance, there were 15 students to every faculty member in the Austin metropolitan area and 16 in Dallas. However, Texas metros only managed to land spots in the lower half of the ranking for this metric.
Preparing For the Future: Boulder Shines for Ratio of Training Facilities
Practical training allows students to get hands-on experience working in their field of study and helps them better understand the day-to-day tasks they’ll be dealing with in their careers. It also gives future professionals increased levels of adaptability in dealing with various scenarios.
For this metric, Boulder, Colo., obtained the highest score with roughly 72 training establishments for every 100,000 residents within the metro area. That was significantly more than Trenton’s 47 facilities in second place or San Francisco’s numbers in third place, although the California metro serves a much more plentiful talent pool than the other two.
Next, the Bridgeport, Conn., and San Jose, Calif., metros shared a very similar ratio of training establishments (43 per 100,000 residents). And, outranking seven other Southern metros on the list, Austin, Texas, secured a spot in the top 10 due to its share of 35 training facilities for every 100,000 residents. Then, in 12th place with 33 training establishments, Madison, Wis., was the highest-ranking Midwest metro for this indicator, ahead of both Chicago (#21) and Columbus, Ohio (#30).
44% of Jobs in San Jose, Calif., & Washington, D.C. Are High-Qualified; Boulder, Colo., & Austin, Texas, Boast Fastest Increases in High-Skill Workers
The share of highly qualified jobs within the labor market is a key indicator of a healthy local economy that’s able to generate business activities that attract the best talent from both nearby areas and other states. For this reason, we also looked at metro areas that had the highest percentages of high-skill occupations, as well as the fastest-growers in that category between 2021 and 2022.
Here, San Jose, Calif., and Washington, D.C. were nearly tied with 44% of jobs in their respective labor markets categorized as high-qualified. In the case of the California metro, that translated to roughly 486,000 jobs for top talent. Granted, as the administrative and political hub of the country, Washington, D.C. offered more than triple the number of high-qualified occupations (1.3 million).
At the same time, approximately 33% of New York metro residents work jobs that require a high level of expertise. While that percentage is very close to the average performance for this metric among the top 30 metros, it also translated into the largest number of people with this level of qualification (3 million).
For comparison, Boulder, Colo., had 42% of its employed residents working within positions that required higher qualifications and also boasted the highest percentage increase in these types of jobs: Between 2021 and 2022, the Colorado metropolitan area added nearly 10,000 high-skill occupations to its labor market for a 14% hike.
Likewise, Texas metros Austin and Dallas followed suit with 11% increases across the surveyed period. While the rate of growth measured by percentage slightly favored Austin, when we looked at the number of employees, Dallas led by a mile after adding to its roster 110,000 jobs that required advanced qualifications versus Austin’s 39,000.
At the other end of the spectrum was Durham, N.C. Although it had the second-highest percentage of people employed in high-skill jobs among Southern entries in the ranking (39%), it was also one of the few among the 30 metros to experience a loss in the number of occupations within this category, unfortunately. Specifically, several media and tech companies in the Research Triangle decided to downsize. Thus, between 2021 and 2022, Durham went from 118,000 to 109,000 high-skill jobs to suffer a 7% dip.
Silicon Valley & New York Still Most Generous Employers of Top Talent
Despite the steep rise in living costs during the last decade, Silicon Valley and New York remained the top destinations for some of the best talent in the country and the world — thanks, in no small part, to their attractive wages.
Notably, a look at the data revealed that the West and Northeast were home to the highest numbers of metros that boasted salaries above the $100,000-per-year-threshold. In particular, the top high-skill earners were located in the San Jose, Calif. ($134,000); San Francisco ($131,000); and New York metros ($126,000).
Across the South, it was Washington, D.C. that stood out by offering an average wage of $117,000 per year to highly qualified workers. Nearby, the Baltimore and Durham, N.C., metros were runners-up with yearly mean salaries of $103,000.
It’s worth mentioning here that only two Midwestern metros hit the $100,000-mark for these types of jobs: Madison (with an average salary of $105,000 per year) and Chicago ($103,000). Interestingly, while Madison ranked 16th for this metric and provided a more modest salary for highly qualified individuals when compared to the leading metros from other U.S. regions, it nevertheless outranked larger metros, such as Denver; Dallas; and Austin, Texas.
The Trifecta of Opportunity: Reno, Nev.; Salt Lake City; & Trenton, N.J. Record Highest Job Mobility
Job mobility fulfills a number of different roles: It allows workers to expand their skillsets by taking on new challenges; it provides a reward for loyalty and progress within a company; and it can also contribute to work/life balance.
In this scenario, Reno, Nev., ranked first for this metric after more than 5% of its employed population with a bachelor’s degree or higher changed jobs in the first half of 2022 without an unemployment spell. It was followed by the Salt Lake City and Trenton, N.J., metros – which were separated by less than one percentage point.
In fifth place with 4%, San Jose, Calif., had the highest job mobility for high-skill workers among metropolitan areas on the West Coast, while Dallas earned a seventh-place finish for this metric to rank highest among Southern entries.
Clearly, the COVID-19 pandemic marked an inflection point in the market as many workers decided to switch jobs in hopes of advancing their careers. While our analysis focuses on the mobility of highly trained individuals, a 2021 report released by McKinsey argued that, because the number of low-skilled jobs shrank significantly during the pandemic, most of the growth in labor demand — and the associated job-to-job mobility — will come from high-skill, high-wage jobs in the future.
At Half National Average, Baltimore Claims Lowest Unemployment Rate Among Metros
The national unemployment rate as of September 2023 was 3.6%, and two-thirds of the metropolitan areas that made it into our ranking had lower unemployment than the U.S. average with Baltimore heading the list. At 1.8%, the Maryland metro was nearly 2 percentage points below the national rate, closely followed by Manchester, N.H., in second place with 2.3%.
At the opposite end, Los Angeles has the highest unemployment rate within the ranking at 5.3%, just more than one percentage point deviation from the national average. The Chicago metro was second to last for this indicator with 4.7%.