Tossing the Affordability Coin
NAR economist George Ratiu discusses how rising student debt levels impact the largest share of homebuyers—Millennials—and how the affordability landscape is shaping up across several major metros.
By George Ratiu

Population growth is generally considered a desirable characteristic for a country’s economy, especially one centered on consumption. A larger number of productive people translates into higher economic output, income, tax revenues and demand for products and services. By contrast, a country experiencing stagnant or negative population growth also tends to face economic decline.
From that perspective, the United States has benefited from continued population gains over the past decade, as it has recovered from the impact of the Great Recession. Census Bureau data indicates that the U.S. population expanded 8 percent from 2007 to 2017, adding more than 24 million people. That growth also brought significant demographic shifts. America is skewing younger, with people under the age of 50 accounting for more than 60 percent of the population. Generations X, Y and Z dominate the landscape, offering a more youthful horizon for economic potential. Millennials—Generation Y—have recently overtaken the Baby Boomers to become the largest demographic cohort in the nation’s history.

George Ratiu
The population expansion has helped increase the gross domestic product at an average annual rate of 2.2 percent from 2010 to 2017, boosted by steady consumer spending. Moreover, concerns over Millennials’ supposed lack of interest in buying homes, owning cars or spending money have turned out to be overblown. The cohort has turned out to exhibit consumption habits similar to those of prior generations, especially as they reached their 30s and started families. Currently, the Millennial generation accounts for the largest share of homebuyers. According to National Association of REALTORS® data, buyers 34 years old and under accounted for 30 percent of home purchases in April.
Exploding student debt
On the flip side of the coin, this younger consumer base has had to contend with several factors which have been negatively impacting it. Younger generations have experienced soaring higher education costs, which have created increasing debt loads. As recently as 2000, aggregate U.S. student debt stood at $84 billion. By January 2018, the total had surpassed $1 trillion.
A NAR consumer survey shows that a quarter of respondents carried student debt between $50,001 and $100,000, while close to one in five reported debt exceeding $100,000. Equally important, 32 percent of participants declared that they had defaulted on their student debt. When the data was broken down by the amount of debt, the percentage of failure to pay remained significant, ranging from 28 percent—for those with debt loads above $100,000—to 36 percent for those with debt in the $40,001-$70,000 range. Default rates proved elevated, as well, ranging from 21 percent for those earning more than $75,000 to 41 percent for those at the lower end of the income spectrum.
Considering that student loans cannot be discharged through bankruptcy, the economic impact of this rising liability has been evident. On the real estate side, the ability to save for a down payment and buy a house has been front and center. In the same NAR survey, respondents pointed out several choices which were negatively impacted by existing student debt—purchasing a home (76 percent), taking a vacation (72 percent), buying a car (65 percent) and continuing education (64 percent).
Another factor hampering the potential of a growing population has been housing supply. According to a study by consulting firm ECONorthwest, between 2000 and 2015, housing underproduction reached 7.3 million units, mostly in coastal states. Considering that over the past two years new home construction has been under pressure due to rising commodity prices and a significant labor shortage, the figure may be slightly higher. Not surprisingly, as demand advanced and supply lagged during the economic recovery, home prices have been on an upward trend. Over the past five years, prices have appreciated at about 6 percent every year compared to about 2 percent in the case of real incomes. The gap has brought about a significant affordability challenge.
Assessing affordability
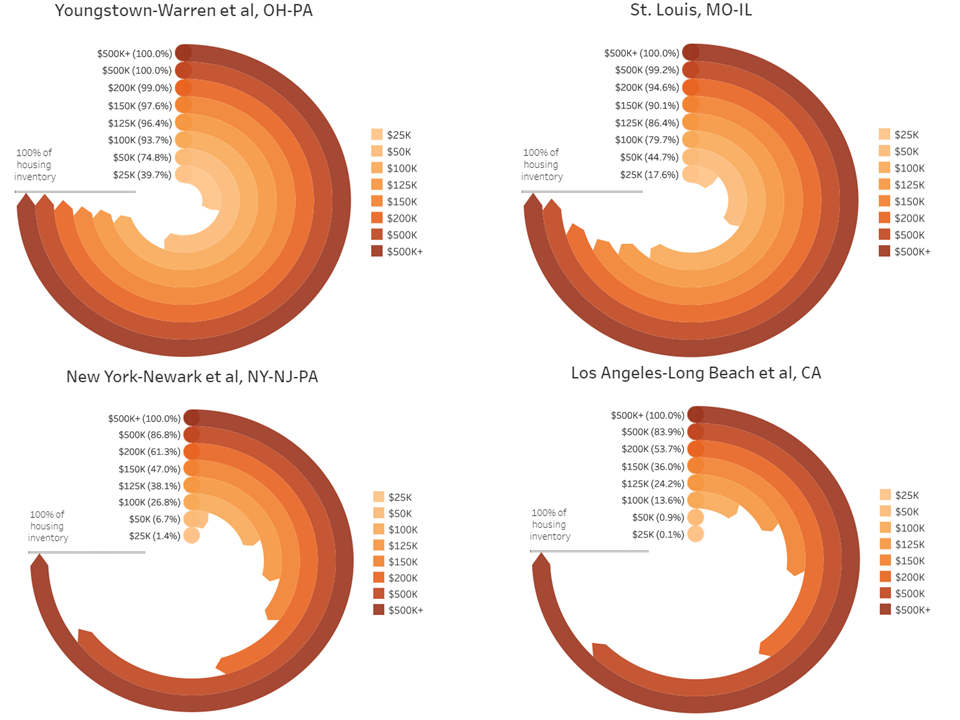
One way of looking at the current affordability landscape is to consider how existing affordable inventory stands in relation to varying income levels. NAR in partnership with REALTOR.com has developed a couple of metrics—the REALTORS® Affordability Distribution Score and Curve—which quantify the percentage of existing inventory attainable to buyers at various income thresholds. These metrics are available for all 50 states and the 100 largest metropolitan areas.
 Based on the latest Score data, the states with the highest levels of affordability are clustered, not surprisingly, in the Midwest: Ohio, Kansas, Indiana, Iowa and Missouri. Conversely, Hawaii, California and Oregon are the top three least affordable states, followed by Idaho and Montana.
The affordability picture gains additional nuances when viewed through the Curve metric. In the most affordable metro area, Youngstown-Warren, Ohio, a consumer with a $50,000 income could afford 75 percent of existing housing inventory. In St. Louis, a larger but still affordable metro, the same consumer could afford 45 percent of homes on the market. In contrast, in the New York-Newark MSA, a consumer earning $50,000 could qualify for only 6.7 percent of available homes. And in the least affordable metro—Los Angeles—the same income could afford a consumer less than 1 percent of existing housing.
With the Federal Reserve fully engaged in its quantitative tightening, we can expect a continued upward march for long-term interest rates as well. As mortgage rates rise, so do the costs of housing—a double whammy for household budgets. Even as unemployment dropped below 4 percent and wage pressures have mounted, the ever-larger bite which housing is taking from consumers’ paychecks will continue to act as a drag on economic growth. The silver lining is that demand for apartments should remain strong.
George Ratiu is managing director of housing and commercial research for the National Association of REALTORS®.
You’ll find more on this topic in the CPE-MHN Mid-Year Update 2018.


You must be logged in to post a comment.