Electricity Demand, Prices Heat Up After 2017 Slowdown
Weather patterns dampened demand last year, but customers started 2018 by paying more for power, the U.S. Energy Information Administration reports.
By Paul Rosta

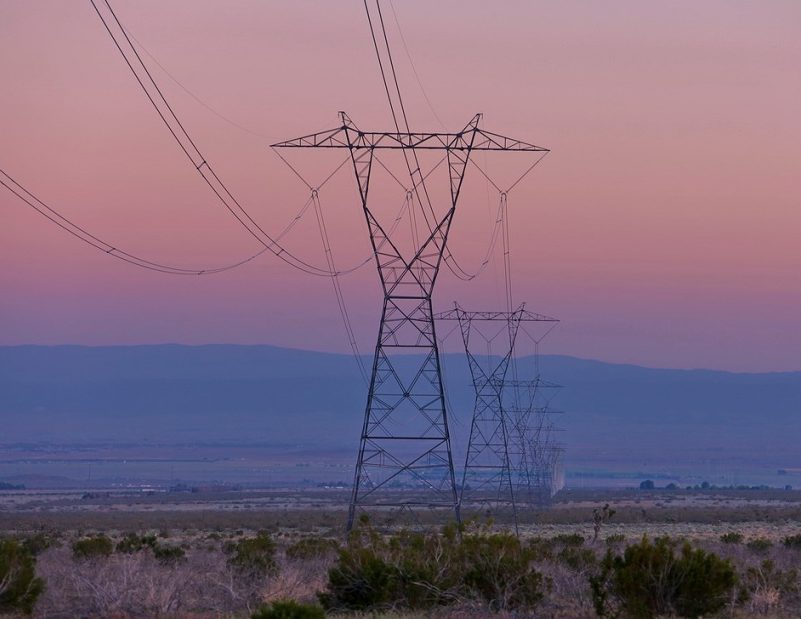
Photo credit: Southern California Edison
Registering the largest decline since the Great Recession, retail power sales dropped 2 percent in 2017 last year, but started off 2018 with a bang. And though renewable remains a relatively small part of the picture, its growth curve continues.
Those are among the key findings of the U.S. Energy Information Administration’s latest survey of energy consumption, generation and pricing trends. All told, power providers supplied 80 billion megawatt-hours less than they did in 2016, and sales reached 3,862 billion megawatt hour, a total comparable to the pre-recession year of 2006.
In its March 2018 report, EIA cited a variety of factors, including pricing, conservation measures and macroeconomic factors, but attributes the lion’s share of the change to weather factors. In particular, a cooler summer reduced the demand for air conditioning. The agency, part of the U.S. Department of Energy, published the findings in its Monthly Energy Report for March 2018.
Electric power purchases in 2017 declined among all three major groups tracked by EIA: commercial customers, which include private businesses, government agencies and private organizations, declined to about 1.35 billion megawatt-hours (mwH) in 2017, and consumption also slipped among industrial customers and residential customers. Total generation by utility-scale facilities declined overall by about 6,000 mwH to 4.01 billion megawatt-hours.
Gas-fired electric generation dipped from 1.37 billion (mwH) in 2016 to 1.27 billion mwH last year. Coal continued its decade-long slide its contribution to the national power grid; nevertheless, the fossil fuel remains the nation’s second-largest source of electricity.
Heating Up
After a mild downturn in 2017, electric consumption got off to a roaring start in 2018. Overall electric generation for January ticked up 9.3 percent compared to January 2017. Categories posting notable gains included gas-fired plants (19.9 percent), solar (51.6 percent) and wind (29.3 percent). At the same time, the renewable contribution to the grid continued to pick up momentum, led by the solar sector.
Although renewables still account for a relatively small portion of the national total, the increase was notable. Utility-scale wind, solar and conventional hydropower all posted significant gains. Generation at utility-scale solar facilities jumped from 36,054 thousand mwH in 2016 to 52,958 mwH last year. Small-scale solar generation also took a major step forward to 24,149 mwH from 18,812 in 2016. According to the Energy Information Administration’s Electric Power Monthly, wind is projected to be the largest renewable source by 2019.
New England was the most expensive place for commercial customers to buy energy in January 2018, with an average price of $16.38 per kilowatt-hour. The region is also home to the five highest-priced expensive energy states in the continental U.S.: Rhode Island, Connecticut, Massachusetts, New Hampshire and Vermont. At the other end of the spectrum, Idaho offered commercial customers the lowest price in the nation, an average of $7.82 per kilowatt-hour.
Average electricity prices for commercial customers sector ticked up from 2017 to 2018, ending the year at 10.68 cents per kilowatt-hour compared to 10.43 cents per kwh for the previous year. That compared to a 35-cent increase for residential properties and a 15-cent increase in the industrial sector.


You must be logged in to post a comment.