Price/LTM FFO
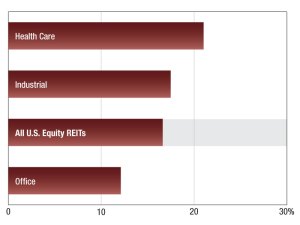
2024 Commercial REIT Values
Dow Jones Equity All REIT Index Price/LTM FFO (x). Read the report.
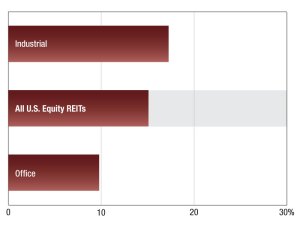
2023 Commercial REIT Values
The latest Dow Jones Equity All REIT Index from S&P Global Market Intelligence.
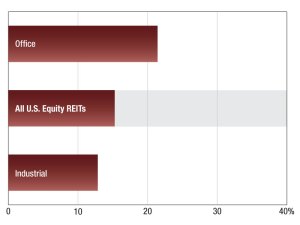
2022 Commercial REIT Values
The latest Dow Jones Equity All REIT Index from S&P Global Market Intelligence.
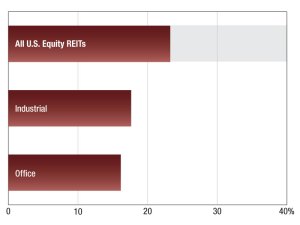
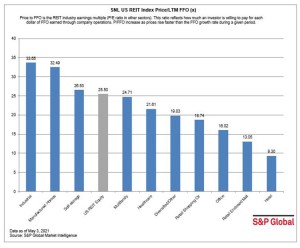
2021 REIT Values
The latest Dow Jones Equity All REIT Index from S&P Global Market Intelligence.
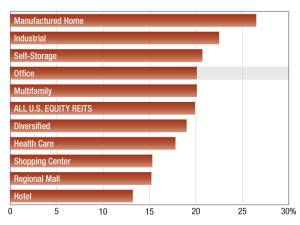
Industrial REITs Lead the Sector for FFO in April
The sector continues to lead the sector in terms of the last 12 months’ FFO multiple.

2020 REIT Values
As of Sept. 30, the manufactured homes sector led all publicly traded U.S. equity REIT sectors in terms of the funds from operations multiple for the last 12 months.

2019 REIT Values
The manufactured homes sector led all publicly traded U.S. equity REIT sectors in terms of the last 12 months.
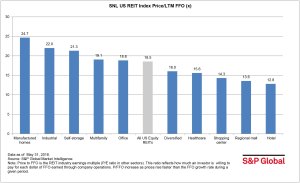
2018 REIT Values
The multifamily sector had a 20.1x last 12 months funds from operations multiple as of Aug. 31, outperforming the broader US REIT index and six other REIT sectors.
Manufactured Home REITs Outperform Market
The sector had the largest last-12-months funds from operations multiple of all publicly traded U.S. equity REITs, at 24.7x, according to S&P Global Market Intelligence data.

Specialty REITs Raise Most Capital Year-to-Date
The specialty sector raised $25.9 billion in capital year-to-date through Sept. 29, with communications REITs raising more than 40 percent of that total, according to S&P Global Market Intelligence data.