Industrial (Occupancy)
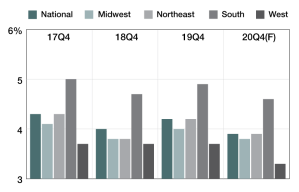
2019 National Industrial Occupancy
Year-over-year industrial vacancy rates compared nationally and by region, updated quarterly.
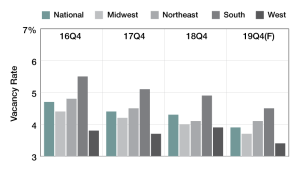
2018 National Industrial Occupancy
Year-over-year industrial vacancy rate percentages compared nationally and by region, updated quarterly.
National Vacancies
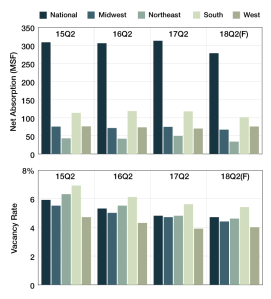
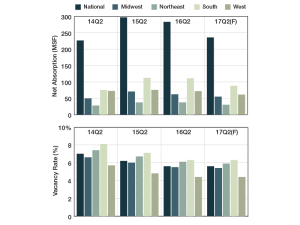
Forecasts show that, in the second quarter of 2018, net absorptions are expected to decrease in every region, with the most significant change expected to come from the Northeast, followed by the South with 13.8 percent.
National Vacancies
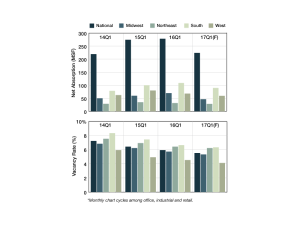
Vacancy rates year-over-year decreased in all regions, with the largest change coming from the Northeast, which tightened to 4.9 percent from 5.8 percent in the first quarter of 2017.
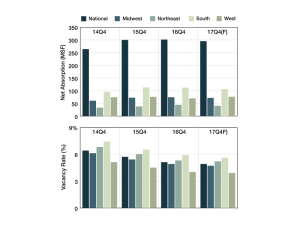
National Vacancies
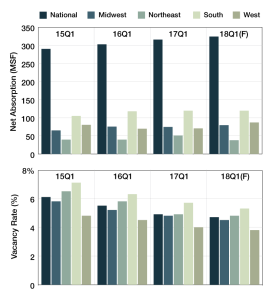
Vacancy rates decreased year-over-year in all the regions, with the largest change occurring in the Northeast, which fell from 6 percent in the fourth quarter of 2015 to 5.3 percent in the fourth quarter of 2016.
National Vacancies
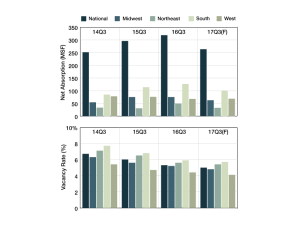
U.S. industrial market conditions from Q3 2014 to Q3 2017*
National Vacancies
U.S. industrial market conditions from Q2 2014 to Q2 2017*
Property Performance
U.S. industrial market conditions from Q1 2014 to Q1 2017*

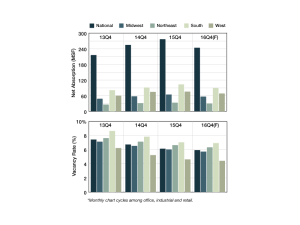
Slower Days to Come
U.S. industrial market conditions from Q4 2013 to Q4 2016*