2018 Retail Construction Starts
Year-over-year comparison of retail building construction starts across the top 10 metros, updated twice a year.
$ in millions

Source: Dodge Data & Analytics
Data by Robert Murray, chief economist, Dodge Data & Analytics
The top 10 metropolitan areas for retail building construction starts mostly registered declines in 2018, with only three markets displaying increased activity compared 2017. The Minneapolis-St. Paul-Bloomington, Minn.-Wis., metro lead the way, posting the largest growth of 58 percent, from $165 million to $260 million. The Boston-Cambridge-Quincy, Mass.-N.H., metro followed suit, with a 38 percent increase, from $307 million to $423 million year-over-year. The New York-Northern New Jersey-Long Island, N.Y., N.J., Pa., metro recorded the smallest increase (up by 4 percent), from $1.2 billion to $1.3 billion.
On the other end of the spectrum, store construction starts dropped by 38 percent, or by $384 million in the Los Angeles-Long Beach-Santa Ana, Calif., metro area, from $634 to $393 million. The Houston-Baytown-Sugar Land, Texas, metro area also posted declines, with construction starts decreasing 33 percent, from $939 million in to $630 million (down by $309 million).
—Posted on Mar. 26, 2019
$ in millions
Source: Dodge Data & Analytics
Data by Robert Murray, chief economist, Dodge Data & Analytics
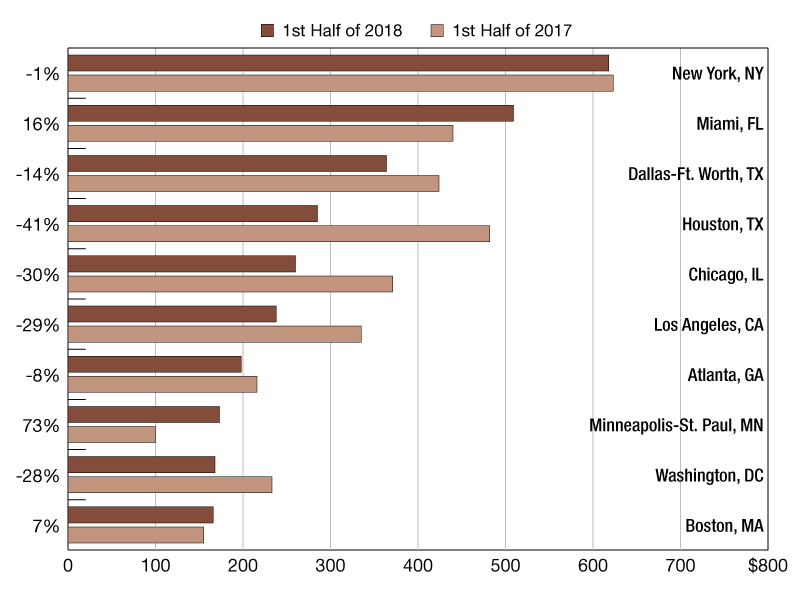
The top ten metropolitan areas for retail building construction starts mostly registered declines in the first half of 2018, with only three markets displaying increased activity compared to the same interval in 2017. The Minneapolis-St. Paul-Bloomington, Minn.-Wis., metro was the leading market, posting the largest growth of 73 percent, from $100 million to $173 million. The Miami-Fort Lauderdale-Miami Beach, Fla. metro followed with a 16 percent increase, from $440 million to $509 million year-over-year.
On the other end of the spectrum, store construction starts inched down by 41 percent or by 197 million in the Houston-Baytown-Sugar Land, Texas, metro area, from $482 to $285 million. The Chicago-Naperville-Joliet, Ill.-Ind.-Wis. metro area also recorded declines, with construction starts dropping 30 percent, from $371 million in to $260 million (down by $111 million).
—Posted on Sep. 13, 2018
$ in millions
Source: Dodge Data & Analytics
Data by Robert Murray, chief economist, Dodge Data & Analytics
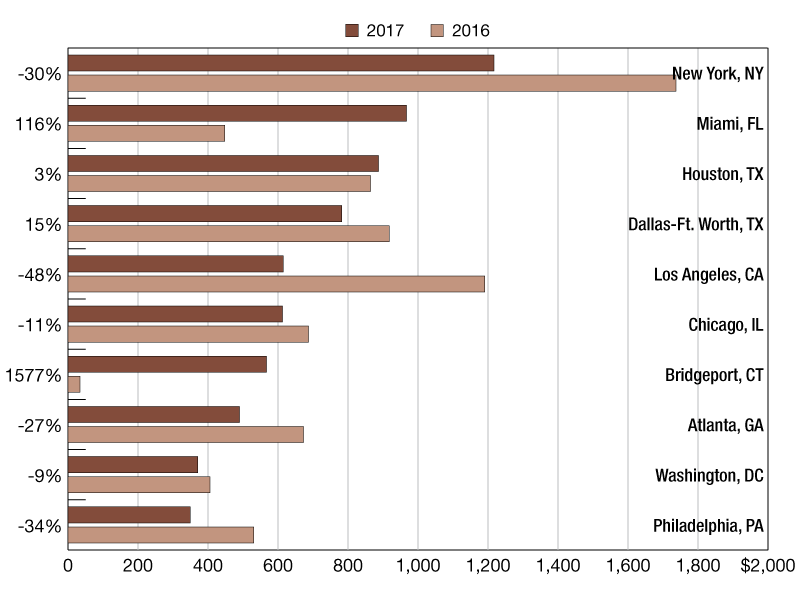
The top 10 metropolitan areas for retail building construction starts mostly registered declines in 2017, with only three markets displaying increased activity compared to 2016. The Bridgeport-Stamford-Norwalk, Conn. metro was the leading market, posting the largest growth of 1577.0 percent, from $34 million to $567 million. The Miami-Fort Lauderdale-Miami Beach, Fla. metro followed suite, with a 116.0 percent increase, from $448 million to $967 million year-over-year.
On the other end of the spectrum, store construction starts inched down by 48.0 percent in the Los Angeles-Long Beach-Santa Ana, Calif., metro area, from $1.2 billion to $615 million. The New York-Northern New Jersey-Long Island, N.Y.-N.J.-Pa., metro area also recorded sharp declines, with construction starts dropping 30.0 percent, from $1.7 billion in 2016 to $1.2 billion in 2017.
—Posted on April 18, 2018

You must be logged in to post a comment.