
It’s the late 1940s. Millions of returning soldiers are looking to start families, resulting in one of the most substantial demographic booms — and an equally substantial housing development boom — in modern history. At the same time, a massive wave of new factories, warehouses and office buildings was underway as the U.S. was entrenching its position as the world’s foremost economic power. Central business districts and industrial zones delineate, and cities across the country start to look more and more like they do today.
Now, real estate is at a crossroads. Urban renewal projects have reimagined old industrial sites, but reshoring promises to create new ones. CBDs are still home to the most office space, but much of it stands unoccupied or is being converted to residential. Consequently, we wanted to look back on the nearly eight decades of real estate history in between and evidence how commercial and residential real estate progressed since the 1940s until today. To that end, we used CRE construction data provided by Yardi Research Data and housing unit data from the U.S. Census Bureau to characterize the 75-year real estate growth across the nation’s 20 largest metro areas, as well as the localization of that growth within specific metros.
Our Analysis: A Quick Explainer
- Office, industrial and retail real estate development as well as housing units built every decade since the 1940s in cities with more than 10,000 residents located in one of the 20 largest metro statistical areas (MSAs) in the U.S. by population. Metro-wide construction is equal to the construction within all constituent cities, barring those with fewer than 10,000 residents.
- Data on cities with fewer than 10,000 residents.
- Data on cities not located within the bounds of a Census-defined MSA.
- Data on commercial properties smaller than 25,000 square feet.
- We labeled urban areas the cities that the U.S. Office of Management and Budget (OMB) defines as principal cities. These cities are the main anchors of a metro area and concentrate residents and economic development, being defined through criteria of population and employment. Up to three of the largest principal cities in a metro area also give the respective metro its name (for example, New York-Newark-Jersey City).
- For the purposes of our study, suburban areas are equivalent to all of the cities located in a metro area that are not designated as principal by the OMB. While the OMB’s division is based on modern definitions, we applied it retroactively to the other decades in our study to delineate development between a metro’s high- and low-density areas.
For the longest time, high-density urban areas were the place to be. However, recent trends have shown suburban areas growing at the expense of urban ones. Downtown building use cases are currently far more work-centric (69.7%) than live (15.9%) or play (14.5%). A rebalancing may be in order.
—Doug Ressler, Senior Analyst and Manager of Business Intelligence at Yardi
We split our data by urban and suburban areas within the same metro, analyzing office, industrial and retail as well as residential units in separate sections:
Key Highlights
- The New York metro area maintained a steady lead ahead of all other locations, growing from 272 million square feet in 1949 to 747.5 million in 2025.
- Metro Washington, D.C.’s office grew to be the second-largest in the nation, rising from a mere 14 million square feet eight decades ago to 411.6 million today.
- Phoenix is the metro area with the highest concentration of office space in its urban areas at 93.2%, while the Inland Empire is the least centralized at just under 60%.
Louis Sullivan, the father of the skyscraper, famously said that “What the people are within, the buildings express without.” The 19th-century switch from brick office buildings to skyscrapers — first in New York and Chicago, then across the U.S. — encapsulates the growing role of the office worker in the nation’s economy, and of the central business district as the primary place where wealth is built.
Click the play button on the visual below to start the timeline. A metro level’s inventory is displayed by two concentric circles, one for its inventory in urban areas and one for its suburbs.
In the 1940s, New York’s role as the banking capital of the world was evident through the sheer size of its office market. Greater New York encompassed more than 272 million square feet of office space at the end of that decade — almost five times Chicago’s inventory at the time and more than metros like Atlanta, Boston or Seattle have today. Of course, the lion’s share of New York metro’s office space back then — 254.2 million square feet — was located in New York City proper, with the rest being shared between the metro’s other urban areas — Newark, Jersey City and Lakewood, N.J., to name a few — as well as its many suburban communities.
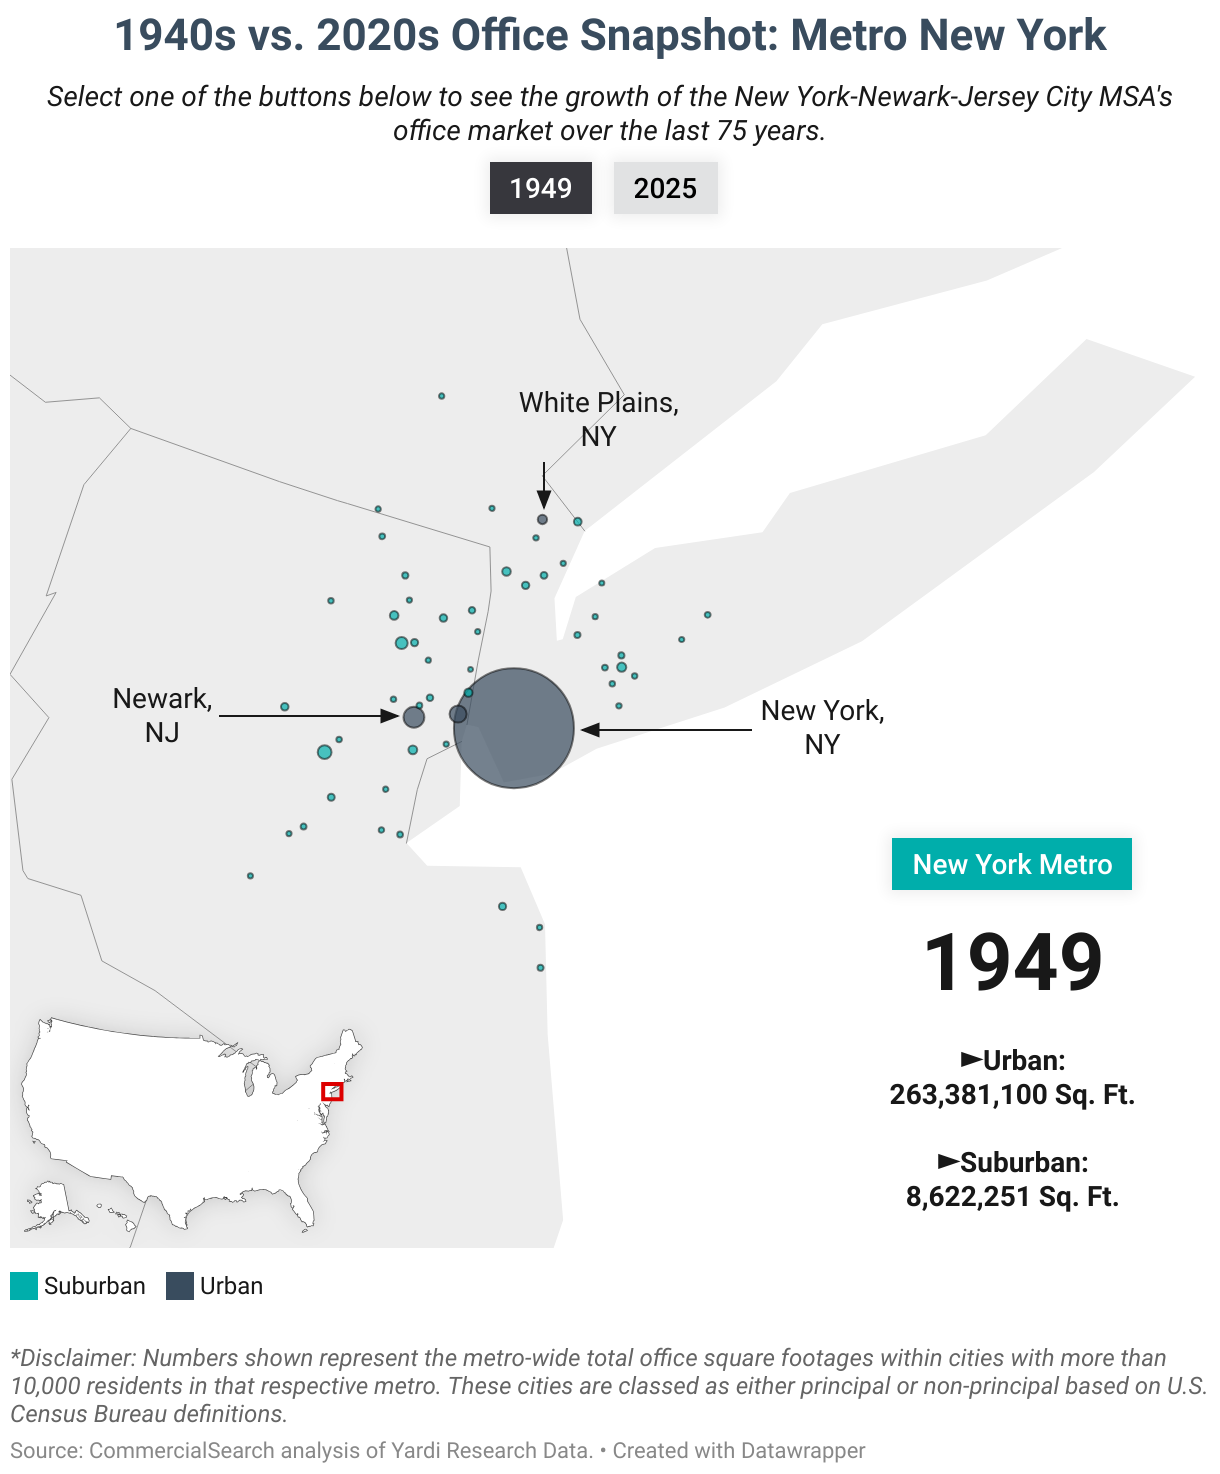
While NYC still dwarfs all other cities in the metro in terms of office inventory, the metro’s total figures are less centralized than they were eight decades ago. Growth areas of Northern New Jersey, Westchester County and Long Island meant that as of 2025, 18.5% of the metro’s office space is located in suburban areas, compared to just 3.2% at the end of the 1940s. Naturally, the chronic lack of developable and infill land in New York City, particularly in Manhattan, is at least partly to blame too.
Home to 411.6 million square feet of office space, the Washington, D.C. metro area is the second-largest office market in the U.S. However, eight decades ago, that would have been hard to believe, as the metro only contained 13.7 million square feet of office space, almost all of it governmental offices contained within D.C. proper.
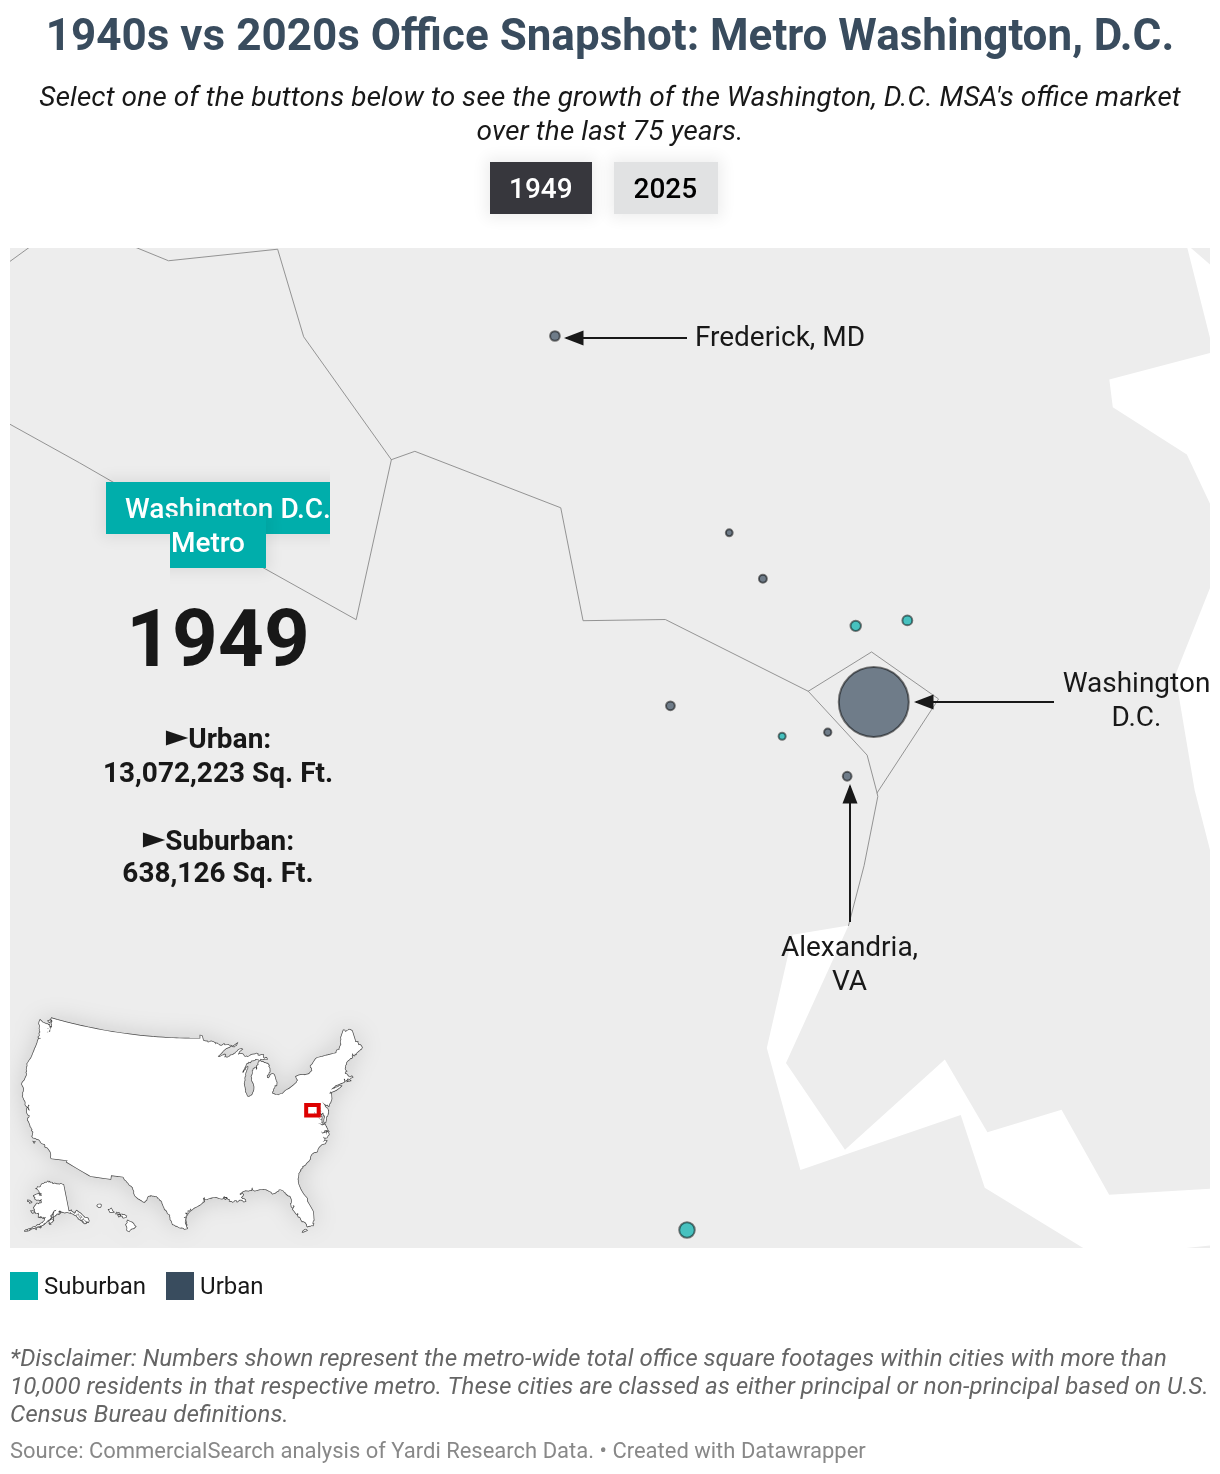
Since then, however, the metro’s office market has seen rapid growth on both sides of the Potomac, turning it into one of the most decentralized office markets in the nation. Today, more than 30% of office space in the D.C. metro area is suburban, with the rest being located in central areas like Arlington, Va.; Alexandria, Va.; or Bethesda, Md., besides Washington, D.C. itself.
Since prestigious locations are more important in the case of office buildings than any other real estate type, it comes as no surprise that all 20 of the nation’s largest metro areas by population have more office space in their urban areas than their suburban ones.
However, the split is far from even. Phoenix boasts the most centralized office market out of all 20 largest metros, as its principal cities (Phoenix; Mesa, Ariz; Chandler, Ariz.; Gilbert, Ariz.; Scottsdale, Ariz.; Tempe, Ariz.; and Casa Grande, Ariz.) concentrate 93.2% — or 138.4 million square feet of office space — of the metro’s total stock. Meanwhile, metro Phoenix’s suburbs are only home to a total of 10.1 million square feet of space, making up the remaining 6.8% of the market. Similar splits can be found in metro San Diego (92.9% in urban areas) and Houston (90.7% in urban areas).
Meanwhile, other metros stand out with a high degree of granularity in their respective inventories, with considerable office stock in areas outside urban cores. These include the Riverside-San Bernardino-Ontario, Calif. metro, where 40.1% of office inventory is located in the suburbs, as well as metro Boston with 38.1%, Denver with 36.4% and Baltimore with 31.3%.
The visual below displays how much office inventory was added the 20 largest U.S. metros in the last 8 decades. The other two tabs display decade-by-decade growth of their office inventories in percentages and the amount added in their urban and suburban areas, respectively.
Key Highlights
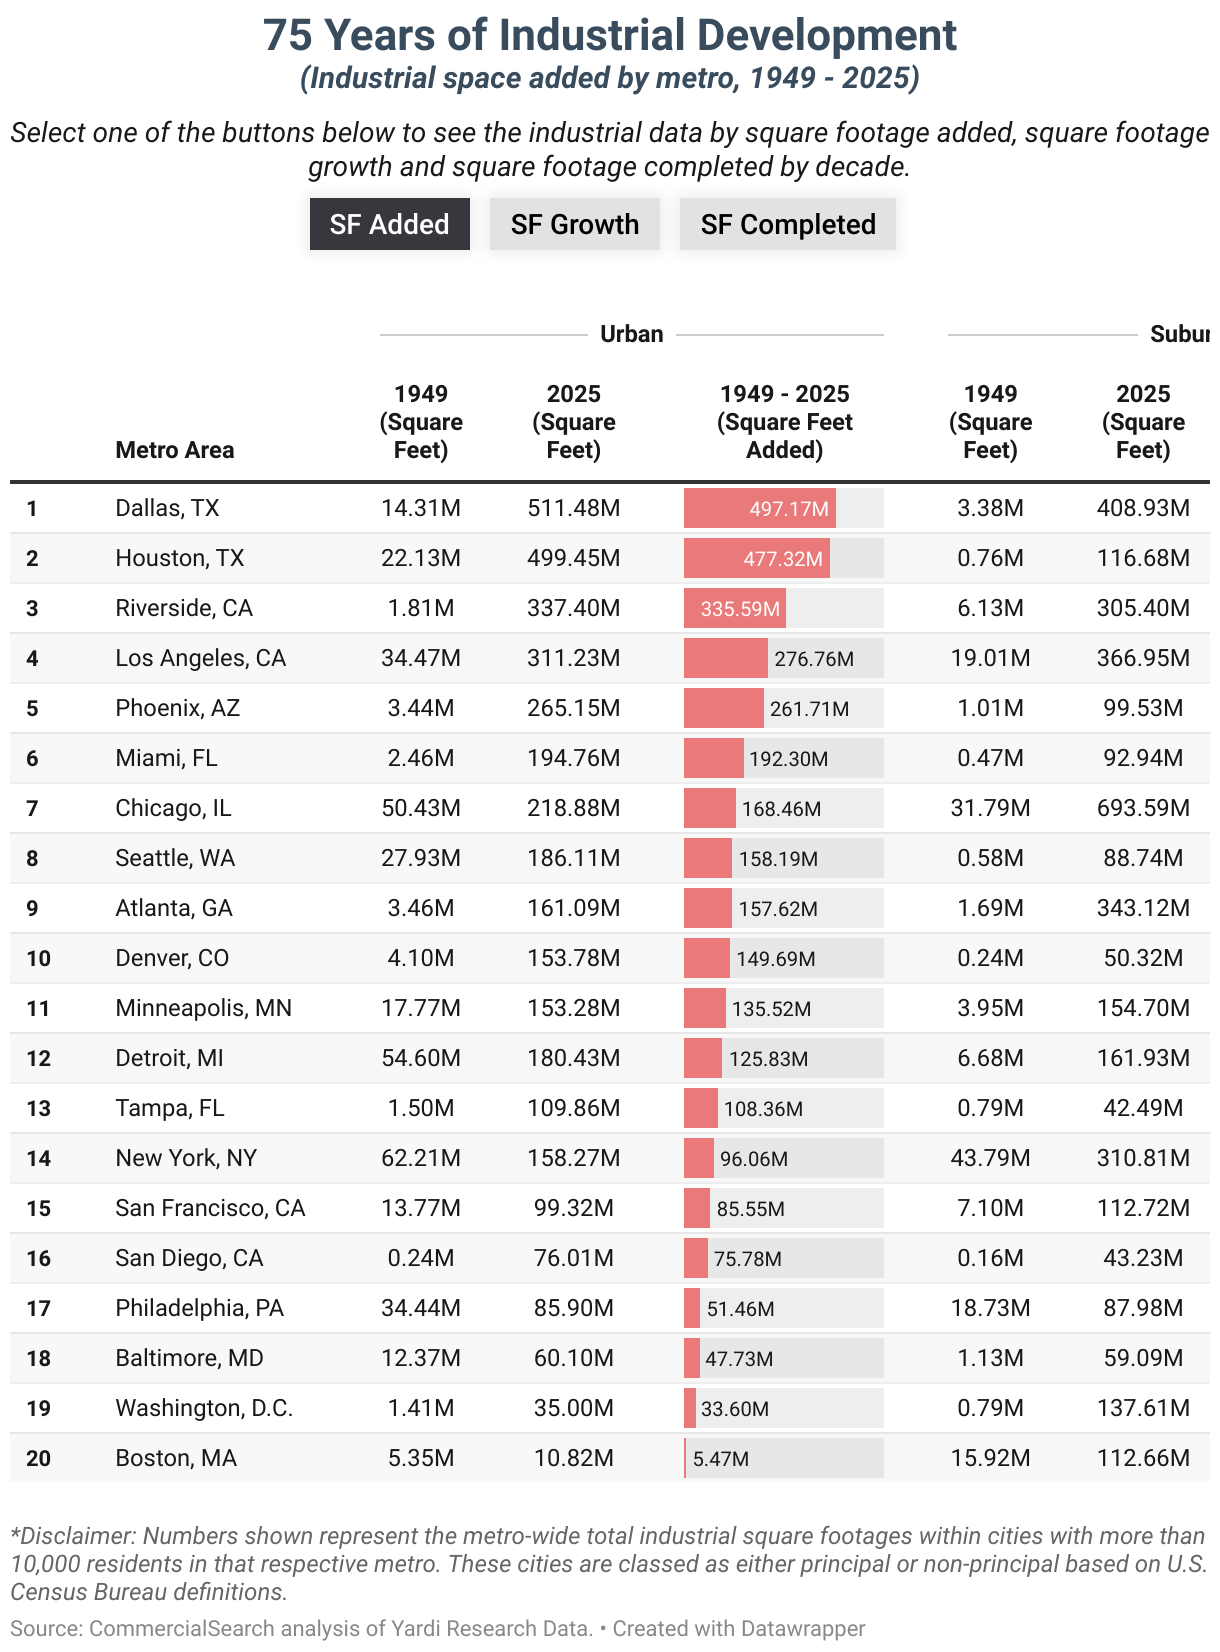
- From an inventory of just 17.7 million square feet of industrial space at the end of the 1940s, Dallas-Fort Worth grew to encompass more than 920 million square feet of space today, becoming the nation’s largest industrial market.
- Chicago is the second-largest industrial market in the country with 912 million square feet of space, three quarters of which is located in the metro’s suburbs.
- Los Angeles development slowed down in the 1980s as space became more scarce, driving development in the neighboring Inland Empire and turning it into one of the biggest markets in the U.S.
In certain ways, the trajectory of industrial real estate was opposite to that of office. While the latter generally moved toward higher-density central areas, factories and warehouses started being developed further away from the urban core due to sprawl and ecological concerns. After several decades of sustained growth, deindustrialization cut development short in many areas of the U.S., though reshoring and supply chain logistics are contributing to an ongoing second wind in the sector.
Click the play button on the visual below to start the timeline. A metro level’s inventory is displayed by two concentric circles, one for its inventory in urban areas and one for its suburban areas.
The post-war economic surge and demand for consumer goods led to rapid industrial development, with 12 of the largest 20 metro areas in the country expanding their industrial inventories by 50% or more per decade in the 1940s, 1950s and 1960s.
The Midwest was the heartland of American industrial output in the 1940s, and Chicago’s steel mills and shipping yards were central to this status. The metro encompassed 82 million square feet of industrial space at the end of the 1940s, 61.3% of which was in its urban areas and the remaining 38.7% in the suburbs.
A decade later, the metro’s inventory had ballooned just under 140 million square feet of space, and to 230 million square feet after another 10 years. Today, Chicago’s inventory stands at 912 million square feet of industrial space in properties larger than 25,000 square feet. Notably, more than three quarters of this inventory is now located in its suburban municipalities, the largest of which are Joliet, Ill. (43 million square feet), Romeoville, Ill. (39.7 million square feet) and Aurora, Ill. (34.9 million square feet).
Chicago held the crown of largest industrial market by overall square footage ever since surpassing Los Angeles in the 1990s. However, Dallas-Fort Worth recently surpassed The Windy City, becoming the market with the largest industrial inventory in the process. Despite being almost five times smaller than Chicago in 1949, the Metroplex’ industrial inventory now totals 920 million square feet of space.
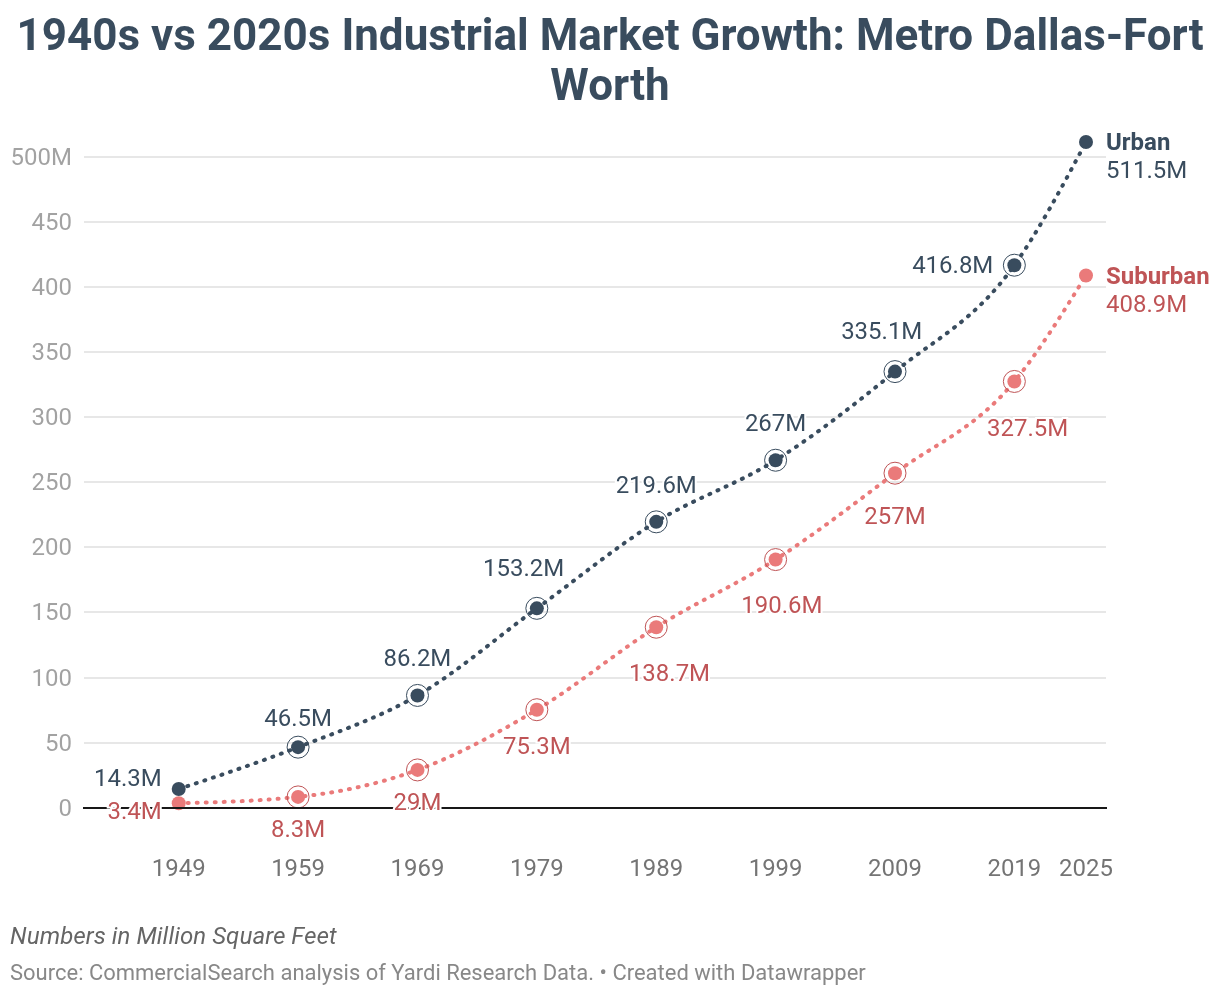
The way Dallas got to this status is through explosive growth in both its central and suburban locations. Fort Worth actually houses slightly more industrial real estate than the city of Dallas at 175.9 million square feet versus 174.4 million. Together with other major cities in the metro like Irving, Arlington and Denton, cities in this category contribute 511 million square feet, or 55.6% of the metro’s total. However, suburbs also contribute a considerable 44.4% of the total, with locations like Grand Prairie, Texas; or Carrolton, Texas having larger inventories than some of the Metroplex’ Census-defined principal cities.
At 678.2 million square feet, Greater Los Angeles hosts the third-largest industrial inventory nationwide. However, when also considering the 642.8 million square feet located in the neighboring Riverside-San Bernardino-Ontario, Calif. metro area — commonly known as the Inland Empire — the entire region is home to one of the largest agglomerations of industrial real estate in the world.
Earlier in its real estate history, the city of Los Angeles proper was home to a majority of the metro’s industrial stock. In fact, by 1949, more than half of Greater L.A.’s total industrial inventory of 53.5 million square feet of space was located in Los Angeles proper, which includes the area of the city extending into the San Pedro Bay and the Port of Los Angeles. Meanwhile, other high-density areas like Torrance, Calif., and non-central ones like Monterey Park or Compton were small blips on the radar when it comes to industrial inventory, while the area to the east encompassing Riverside County and San Bernardino County still largely relied on agriculture.
Once the Port of Los Angeles fully took on the mantle of America’s Port, industrial development took off throughout the metro. After increasing its industrial inventory by 123% in the 1950s, a further 84% in the 1960s and another 75% in the 1970s, new industrial developments in metro Los Angeles dipped to 12.4% in the ‘90s and single-digit growth in the 2010s. Well-positioned non-central areas of the metro are also mostly built out, with 54.1% of its inventory being located in suburban areas compared to 35.5% eight decades ago.
As space for warehouses in Greater LA became scarcer, developers instead looked outside Los Angeles County for more room, setting their eyes on the Inland Empire. The result is a secondary building boom, resulting in a growth of 184% during the 1980s and 90% in the 2000s. Today, the Inland Empire is home to almost as much industrial space as metro Los Angeles, with Ontario, Fontana and Riverside having the largest inventories at 112.1 million, 73 million and 60.2 million square feet, respectively.
Other markets witnessed similar building booms in the period between the 1950s and 1990s. Houston grew from 22.9 million square feet of space in 1949 to 307.1 million in 1999, while Atlanta went from 5 million to more than 300 million in the same timeframe.
And, while most markets saw slower growth into the 2000s and 2010s, some are now cooling off after a brand new surge of industrial development thanks to manufacturing reshoring and the construction of ever larger distribution facilities. Metros including Phoenix, Detroit, Chicago, Denver, Dallas and others have already delivered more space so far in the 2020s than they did in the entirety of the 2010s.
The visual below displays how much industrial inventory was added the 20 largest U.S. metros in the last 75 years. The other two tabs display decade-by-decade growth of their industrial inventories in percentages and the amount added in their urban and suburban areas, respectively.
Key Highlights:
- Retail space eight decades ago was mostly concentrated in central, high-density locations.
- With the advent of car culture and large shopping centers, retail space moved to the suburbs which today host considerable retail inventories.
- Metro Boston has the most decentralized retail market in the U.S., with almost 90% of retail space in the metro being located in suburban areas.
The types of establishments that use retail space has undergone a dramatic shift in the timespan of our study. In the first half of the 20th century, retail space was mostly represented by corner shops, dry goods stores and department stores which relied on foot traffic in high-population areas. However, the birth of automobile culture in the 1950s extended the reach of the average American when it comes to shopping. The rise of the shopping center was made inevitable. The result would be a dramatic shift of retail space from central areas in U.S. metros out towards the fringes, which offered more space for big-box stores, numerous retailers and generous parking lots.
Click the play button on the visual below to start the timeline. A metro level’s inventory is displayed by two concentric circles, one for its inventory in urban areas and one for its suburban areas.
In 1949, all but one of the current 20 largest metro areas in the U.S. had most of their retail space located in their urban cores. For example, 78% of retail space in Greater Los Angeles was located in central areas, while that figure was 80.2% in metro Chicago and 81.5% in Greater New York.
Switching over to the present day, 13 of the 20 largest metros have more retail space in their suburban municipalities compared to urban areas, and the leads held by the urban areas in the remaining seven metros are modest. Power centers and other large types of shopping centers in the suburbs mostly outweigh downtown mom-and-pop stores and high street retail, even as physical shopping takes on a new formula with experiential retail.
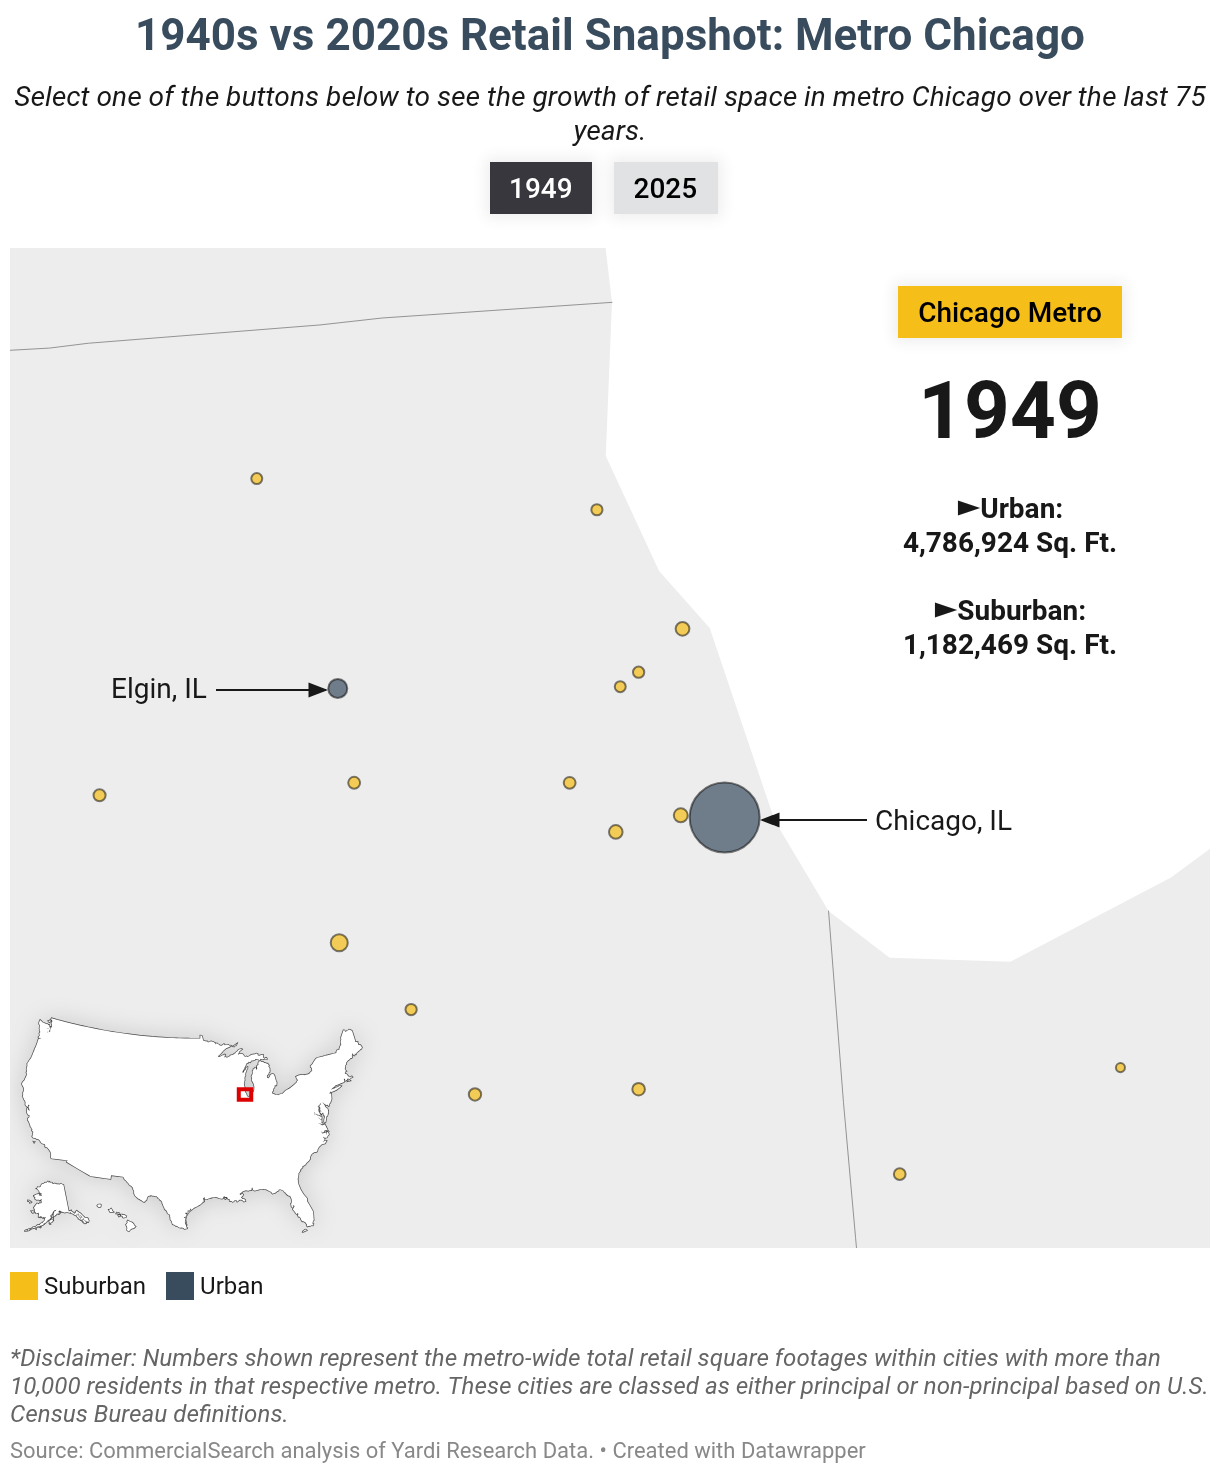
The transformations undergone by the retail industry are perhaps most obvious in metro Chicago. At the start of our study’s timeframe, Chicago proper concentrated around 6 million square feet of retail space, or three quarters of Chicagoland’s total retail space.
Today, the metro’s urban areas besides Chicago house more retail space than The Windy City itself, while its suburbs host 71.7% of the metro’s total retail space. The transition from urban to suburban shopping is evident. The Magnificent Mile and the Gold Coast are still world-renowned shopping destinations, but Chicagoland’s biggest shopping malls are in low-density locations like Schaumburg, Ill. and Oak Brook, Ill.
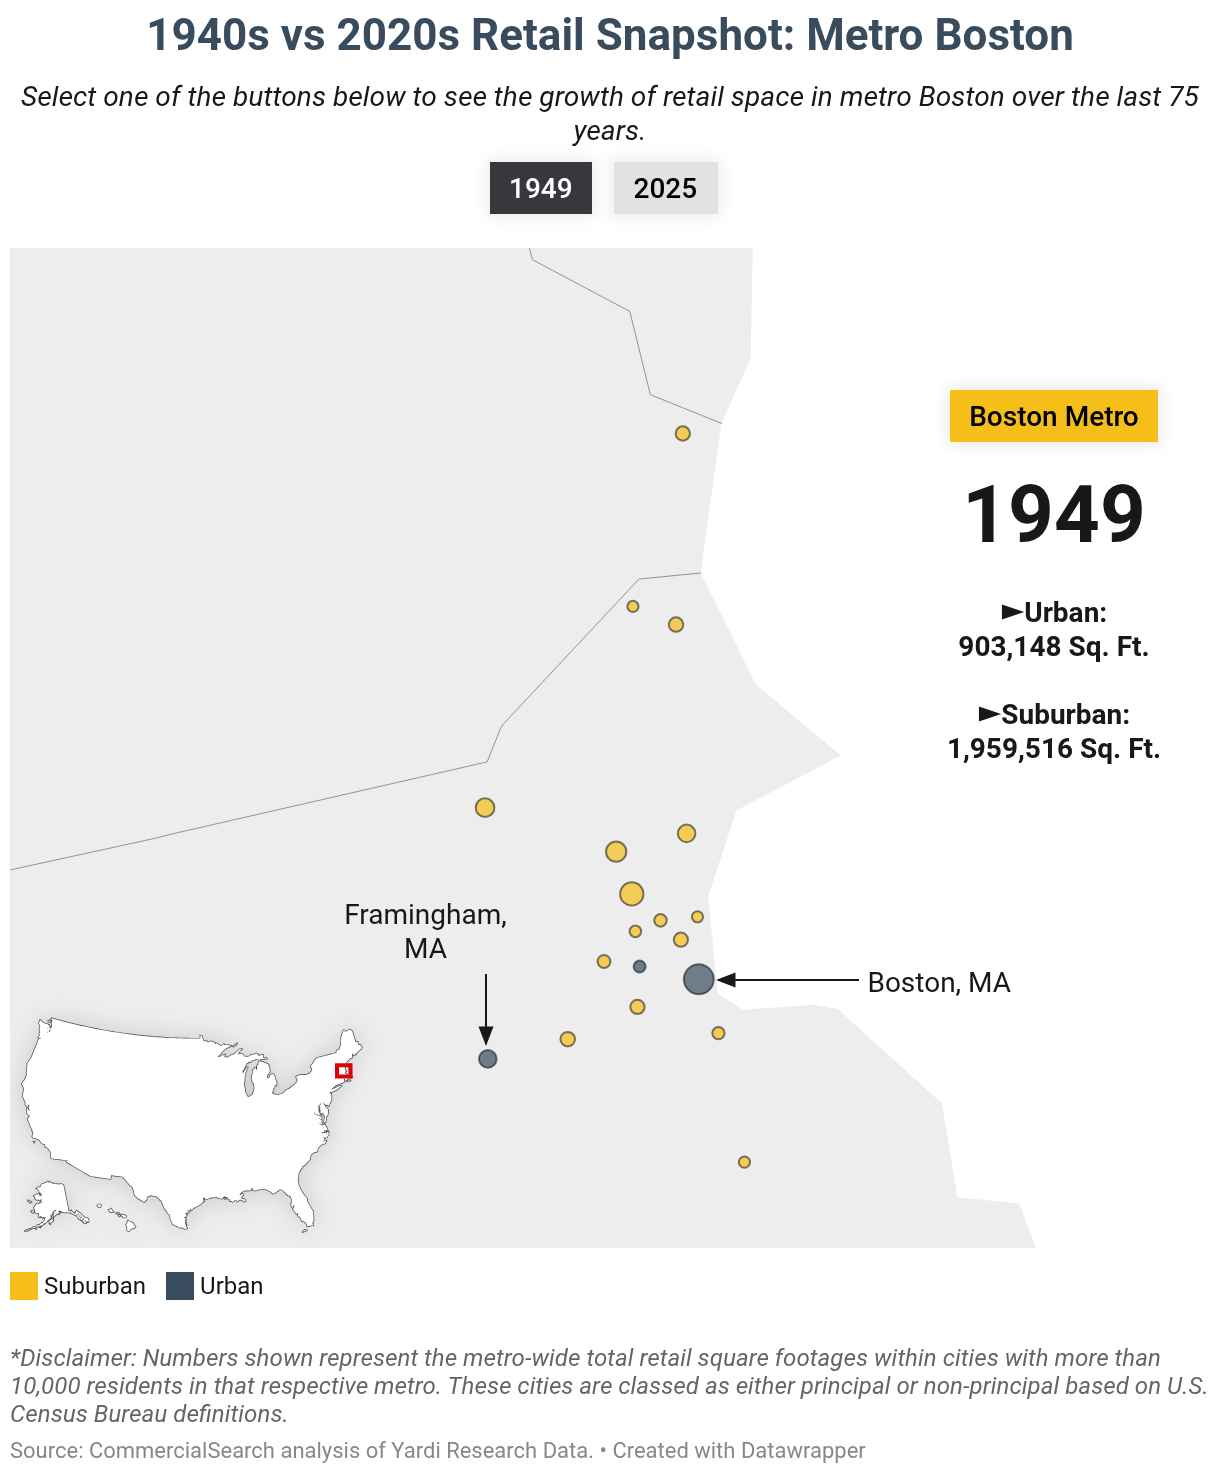
Retail space in Boston, on the other hand, was already decentralized in the 1940s, with towns like Stoneham, Mass., and Reading, Mass. already boasting inventories of comparable size to the metro’s main city. As gentrification attracted more upscale retailers toward the city’s suburbs like Belmont and Somerville, retail space in the Boston metro only continued its granular expansion.
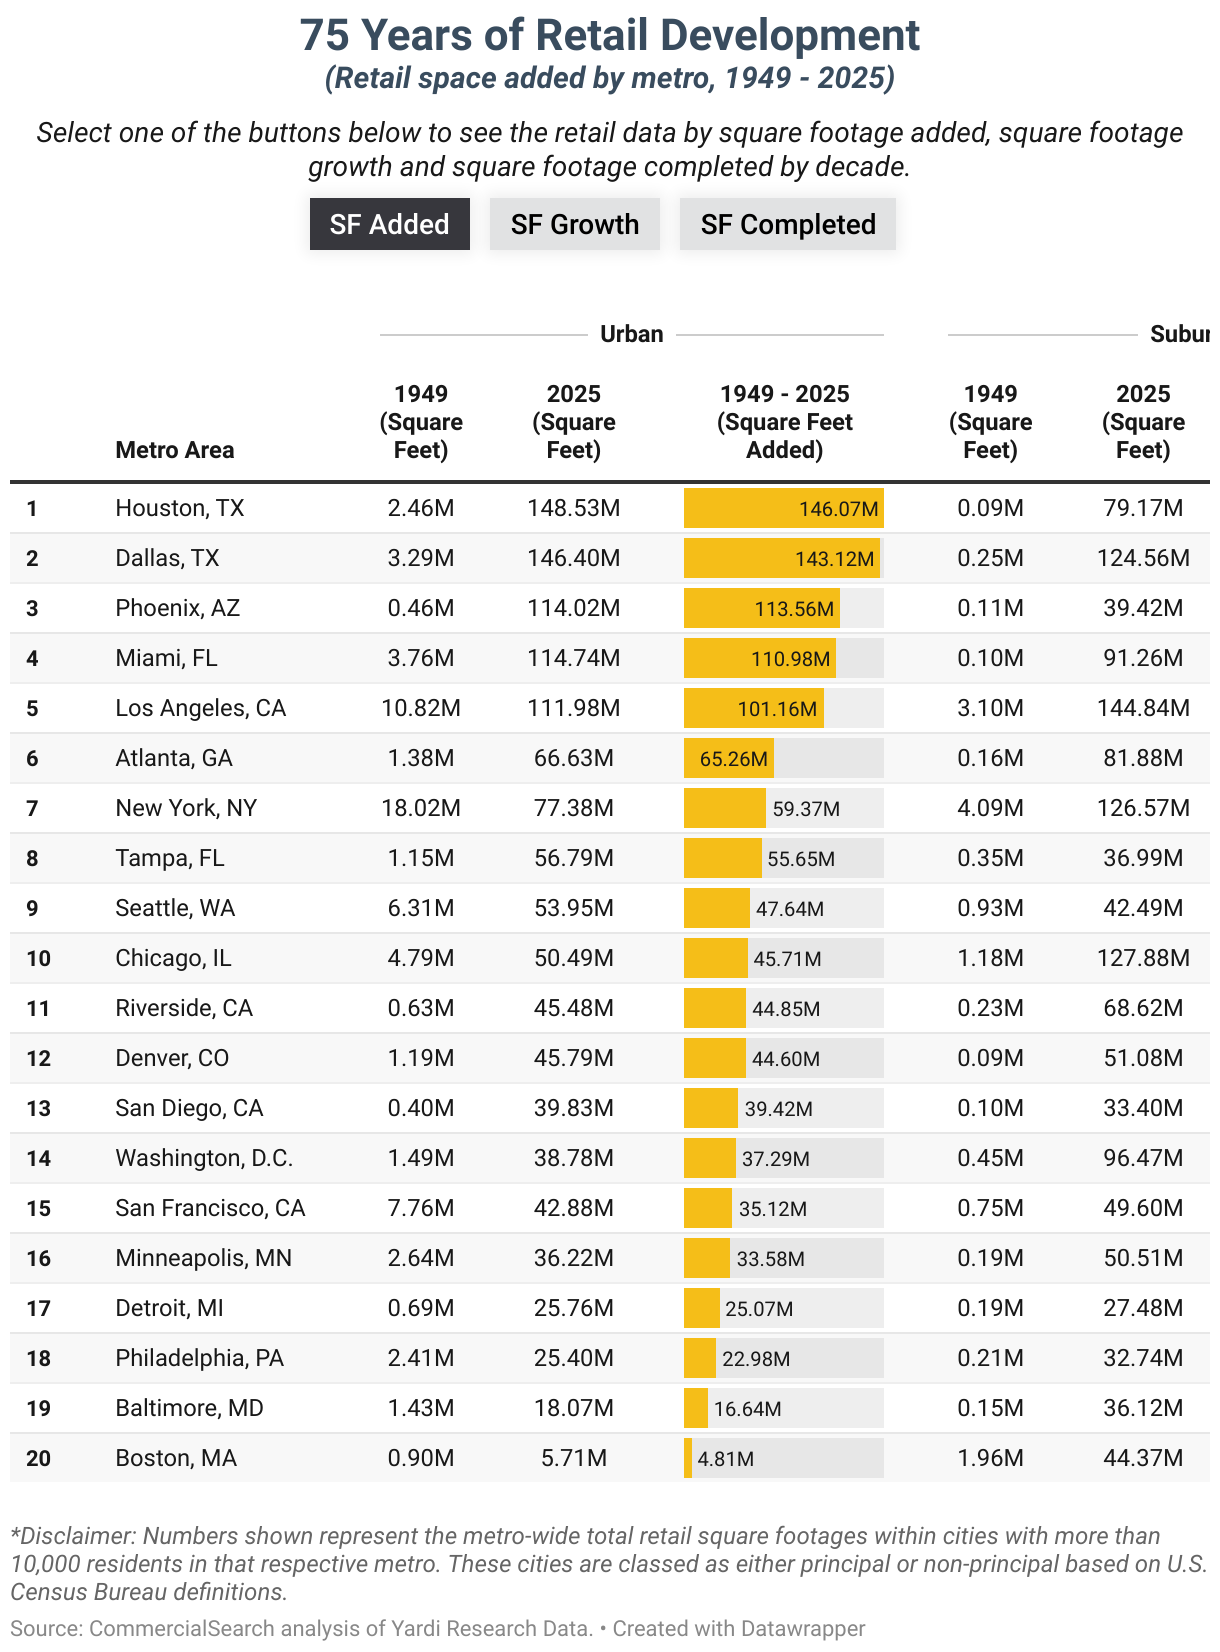
The result is that today, all other urban municipalities except Newton, Mass. and Waltham, Mass. have more retail space than the city of Boston itself, as do many suburbs on both sides of the Charles River like Burlington, Saugus and Dedham. As much as 88.6% of retail space in Greater Boston is located in the suburbs, making for the largest share among all 20 largest metro areas. Other metros with high concentrations of retail space in their suburban areas include Washington, D.C. (71.3%), Baltimore (66.7%)., New York (62.1%) and Minneapolis-St. Paul (58.2%).
On the opposite end, the metros concentrating more retail space in their urban cores were Phoenix (74.3%) and Houston (65.2%).
The visual below displays how much retail space was added the 20 largest U.S. metros in the last 8 decades. The other two tabs display decade-by-decade growth of their retail inventories in percentages and the amount added in their urban and suburban areas, respectively.
Key Highlights:
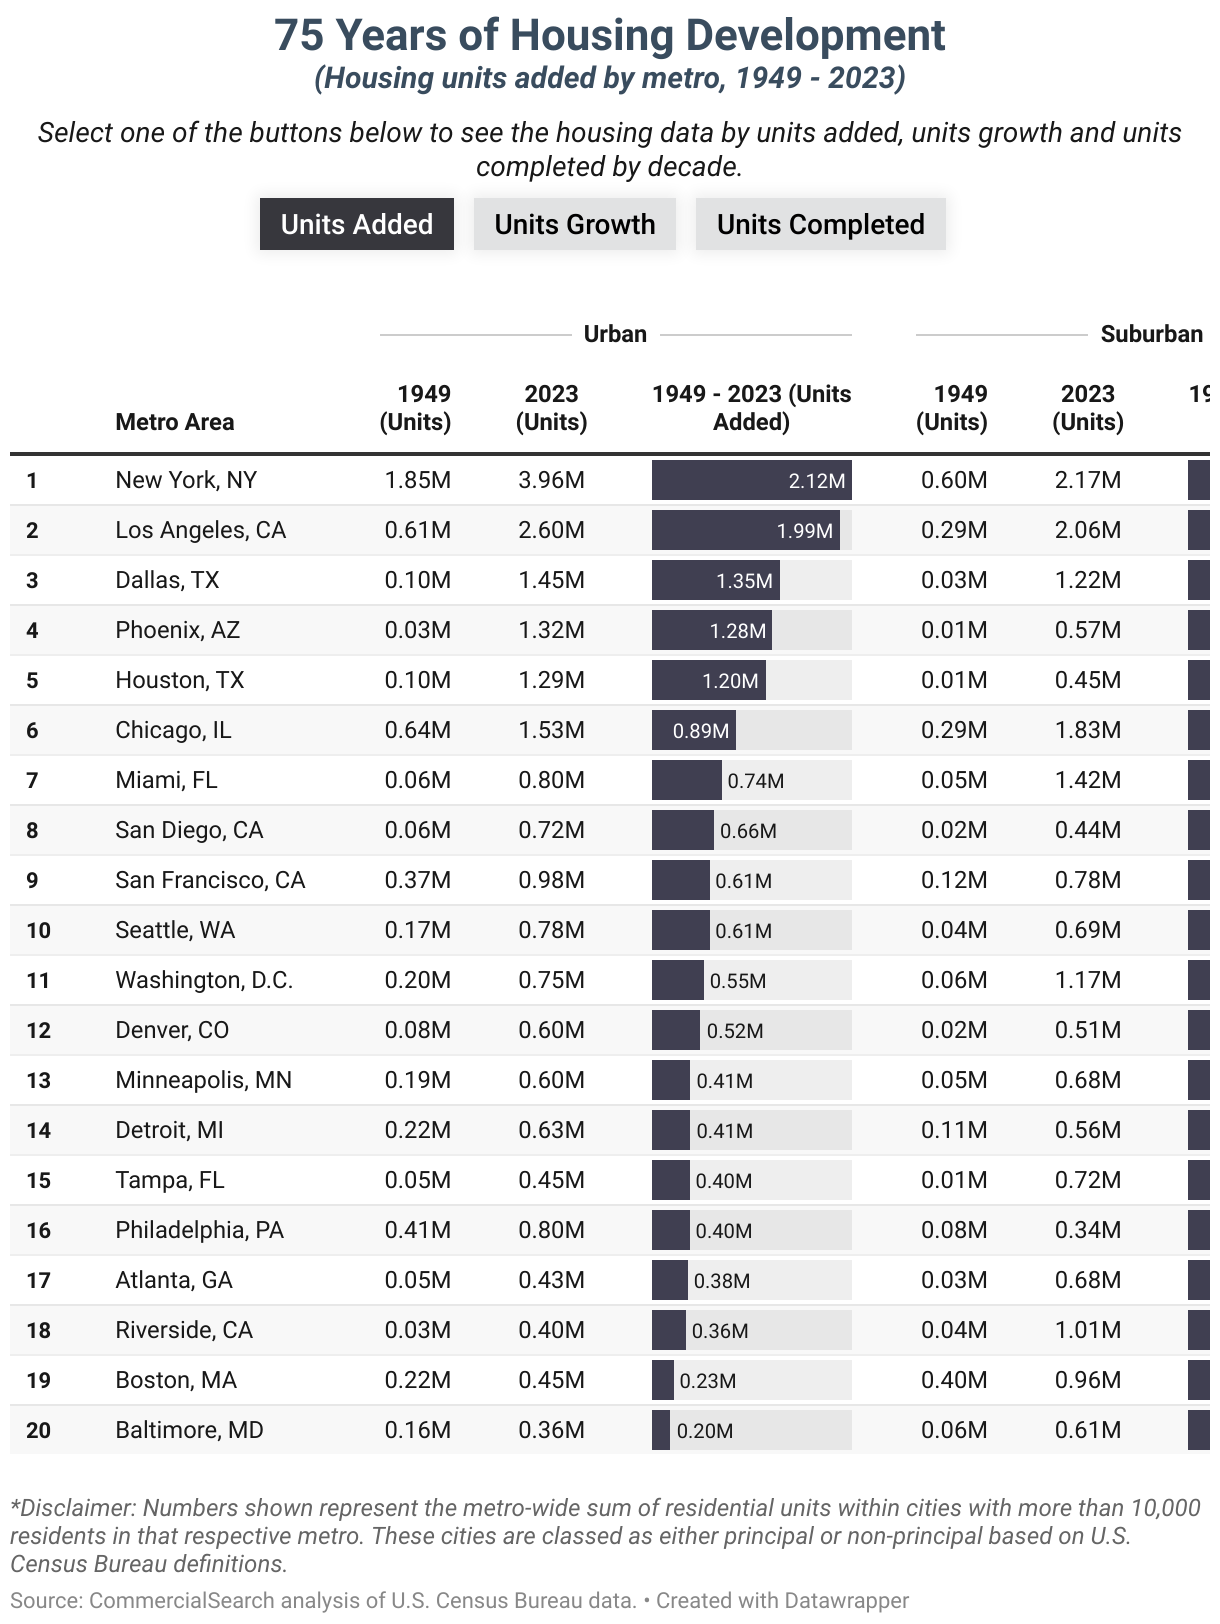
- Housing development rapidly accelerated during the Baby Boom, with several metros tripling or even quadrupling their inventories over two decades.
- More recently, new housing supply slowed considerably, with 12 of the nation’s 20 largest metros dropping to single-digit housing growth in the 2010s.
- The metros with the largest inventory growth so far in the 2020s include Dallas-Fort Worth, Denver and Atlanta.
The population of the United States increased from about 132 million in 1940 to an estimated 350 million in 2025, according to the U.S. Census Bureau. Concurrently, housing expanded to accommodate the rise in population, increasing from just under 8 million units to almost 40 million units across the nation’s 20 largest metro areas over the span of eight decades. However, that growth has been far from uniform. The post-war baby boom saw an outsized number of homes being built, while development has considerably slowed in recent decades.
Click the play button on the visual below to start the timeline. A metro level’s inventory is displayed by two concentric circles, one for its inventory in urban areas and one for its suburban areas.
Most metros in our study predictably saw their greatest housing growth in the two decades between 1950 and 1970, with some — Los Angeles, Chicago, San Francisco and Baltimore — doubling their housing inventories in that timespan. Other metro areas on the rise, like Denver, Atlanta, San Diego, Miami or Dallas-Fort Worth saw their inventories triple or even quadruple over the decades concurrent with the Baby Boom.
Since then, however, housing development has slowed considerably. Out of the 20 largest metro areas in the country, 12 had single-digit housing growth in the 2010s, and even the remaining eight had growth in the low double-digits. Of course, percentage growth figures become smaller as markets grow over time, but the drop is nonetheless considerable. Moreover, U.S. Census estimates for housing units built between 2020 and 2023 show sub-1% housing growth for 10 of the 20 largest metros in the U.S., indicating that a lack new supply is a major contributor to housing deficits.
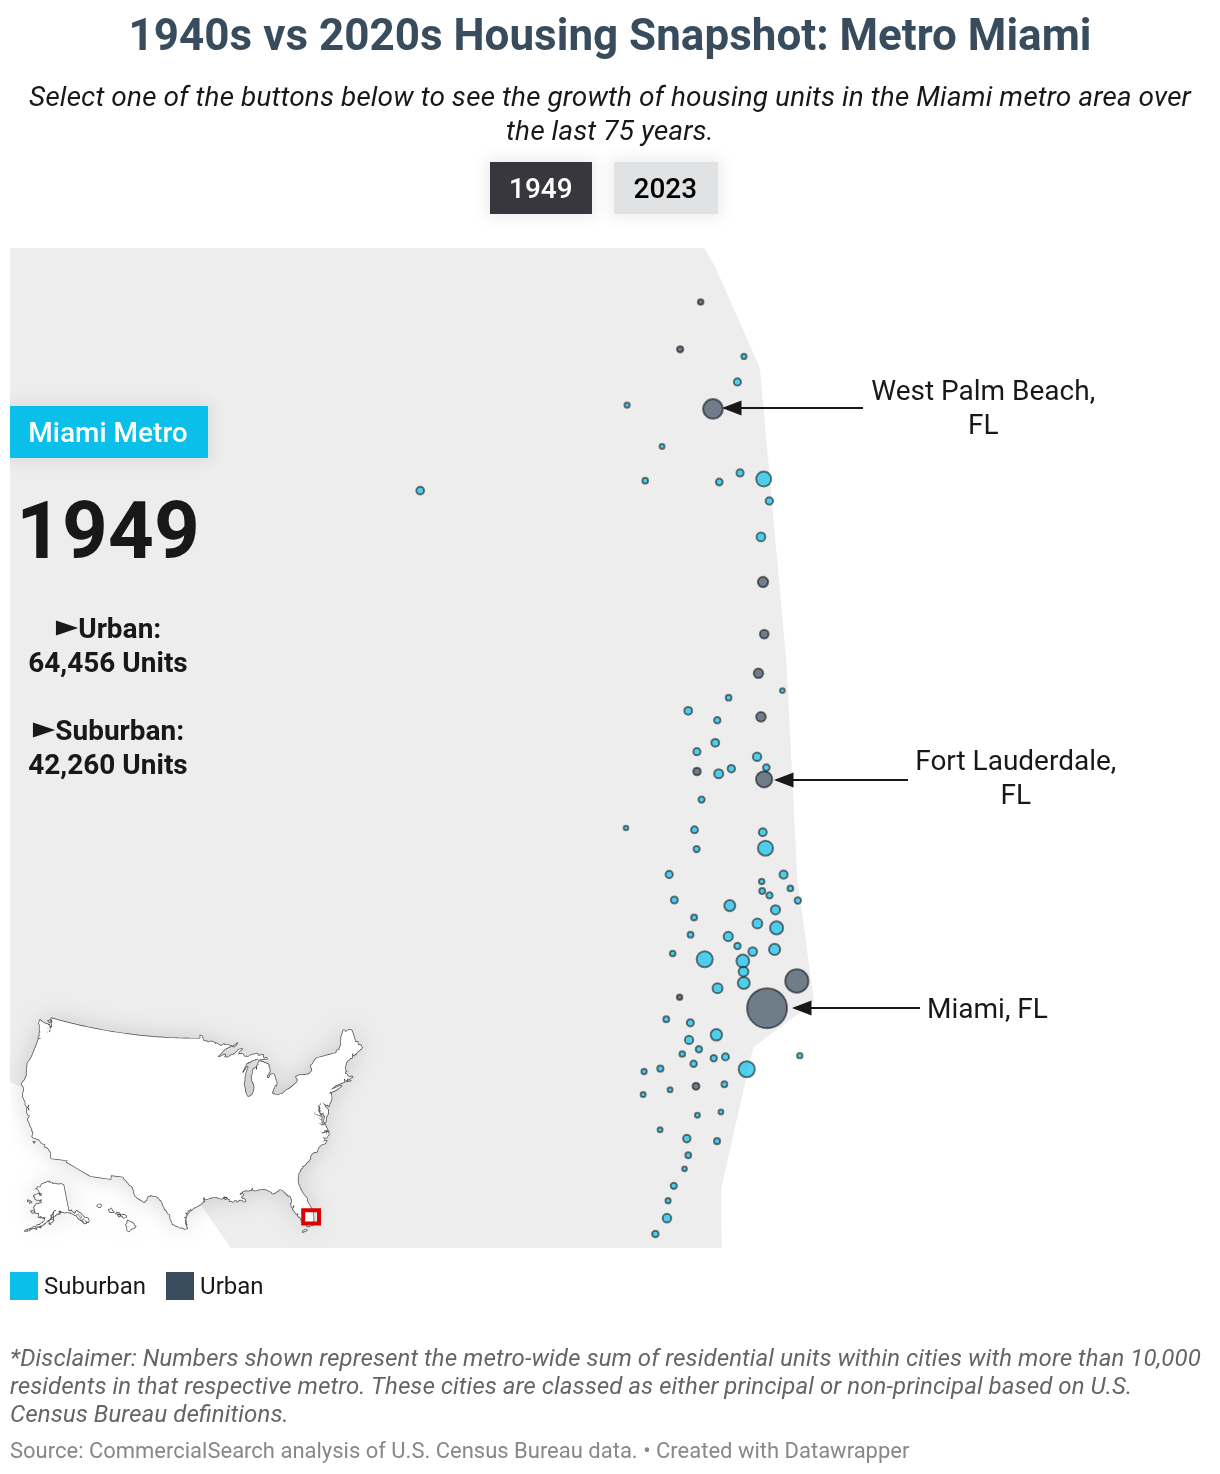
Eight decades ago, Miami and Miami Beach concentrated the lion’s share of homes in Southern Florida, with close to 50,000 units of the metro’s 110,000 total. After considerable development in principal cities like Fort Lauderdale, Fla.; West Palm Beach, Fla.; and Pompano Beach, Fla., but also in a plethora of suburbs all along the coast, the metro’s housing inventory exceeded 1 million units in the 1970s and 2 million at the turn of the millennium.
Since then, however, developments have slowed to a trickle, with the current tally standing at just over 2.2 million housing units — even as retirees and sunseekers kept pouring into the area.
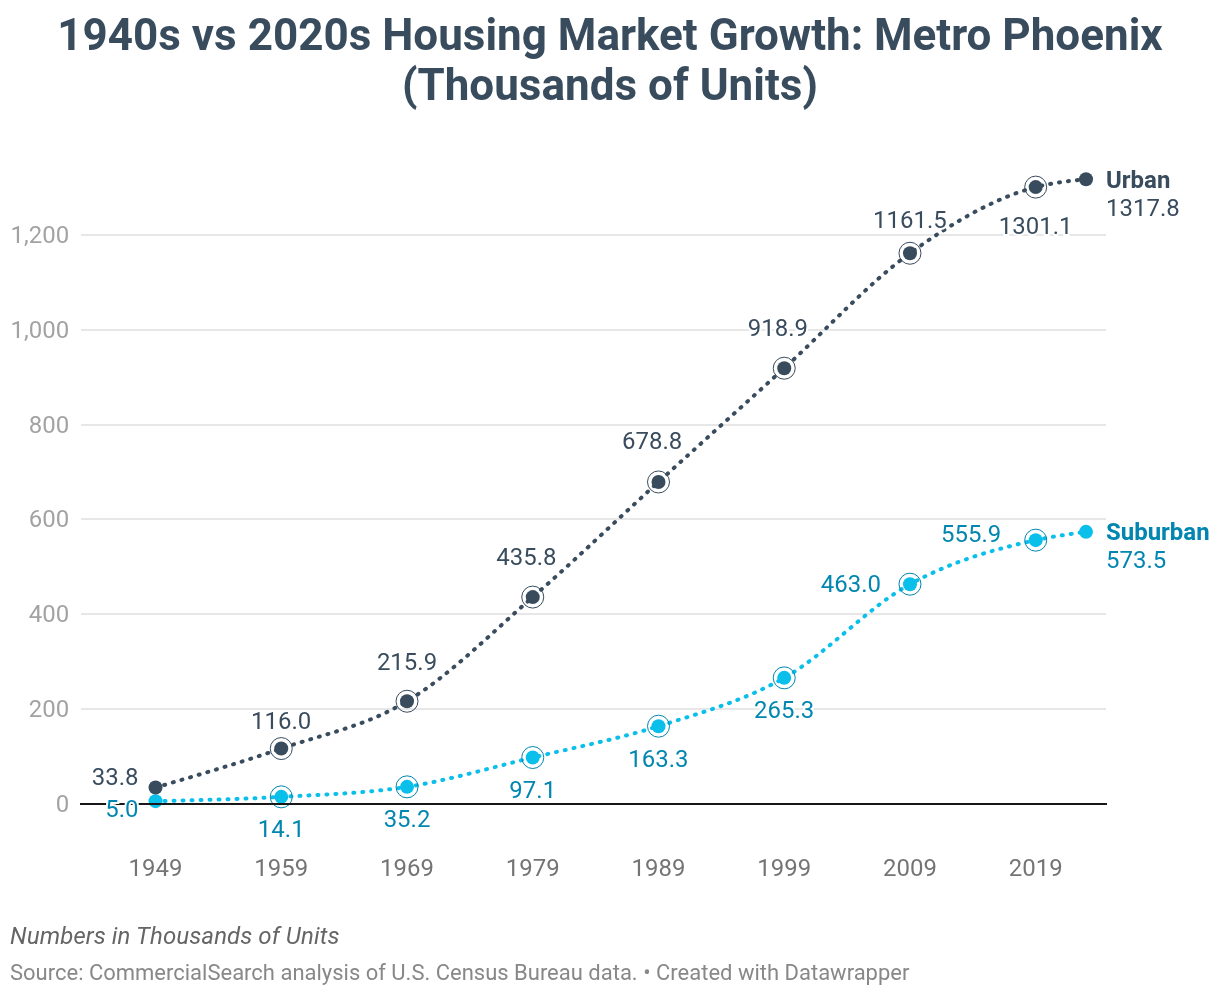
Meanwhile, Phoenix is an example of a Sun Belt city with a similar influx of residents, but with the notable distinction of having ample room to sprawl. The same communities that concentrated the majority of the Valley of the Sun’s 38,000 housing units in the late 1940s also have the highest tallies in the present day. The metro’s three main cities — Phoenix, Mesa and Scottsdale — host more than 1 million housing units of the metro’s 1.9 million. In such cases, ensuring a sufficient density of services and amenities while limiting car-dependence is the greatest challenge that local governments face.
Optimizing real estate development to maximize walkability, property value and economic output doesn’t only ensure that cities thrive and provides dividends to real estate investors and businesses, but first and foremost benefits the public.
—Doug Ressler, Senior Analyst and Manager of Business Intelligence at Yardi
Metros that stand out with relatively high boosts to their housing inventories include Dallas-Fort Worth (19.4% in the 2010s, 2.3% in 2020-2023), Houston (18.4% and 1.8%, respectively) and Denver (15.5% and 1.8%, respectively).
The visual below displays how many housing units were added to the 20 largest U.S. metros in the last 8 decades. The other two tabs display decade-by-decade growth of their housing inventories in percentages and the amount added in their urban and suburban areas, respectively.
Methodology
Our analysis included eight decades of real estate construction data, starting from January 1940 and up to July 2025.
Commercial real estate data for office, industrial and retail properties was provided by Yardi Research Data, and included properties larger than 25,000 square feet completed until July 2025. Due to data constraints, properties that were redeveloped or converted into another use type at any point had the most recent use type applied to their complete history.
Housing unit data was extracted from the U.S. Census Bureau’s latest American Community Survey five-year estimates, published in 2025.
Our analysis included all cities with more than 10,000 residents that are part of a metropolitan statistical area (MSA) by Census definition. Cities that are not part of an MSA were not included in the study. We split the cities in the study into urban and suburban, based on the U.S. Office of Management and Budget’s definition of principal cities. Principal cities were considered to be urban locations, while all other locations not designated as principal while still being part of a metro were designated as suburban. The largest city with at least 10,000 residents in a metro is automatically designated a principal city, but other cities in the metro are also designated as principal cities if they are:
- incorporated or census-designated places that have a population of at least 250,000 in which the number of workers is 100,000 or more.
- places with a population between 50,000 and 250,000 where the number of workers working in the place exceeds the number of working residents.
- places with a population between 10,000 and 50,000 where the number of workers working in the place exceeds the number of working residents and are at least one-third the population of the largest principal city.
The list of principal and non-principal cities used in our study is based on 2023 U.S. Census Bureau population data, but it should be noted that respective cities may have had a different status in another point in time, including in the last eight decades included in the study or the time since the data extraction for the study.